Every layer
62 live map layers in one app: aircraft, GPS jamming, fires, earthquakes, weather, oceans, satellite imagery and the ground itself. What each shows and where its data comes from.
live · things that move
-
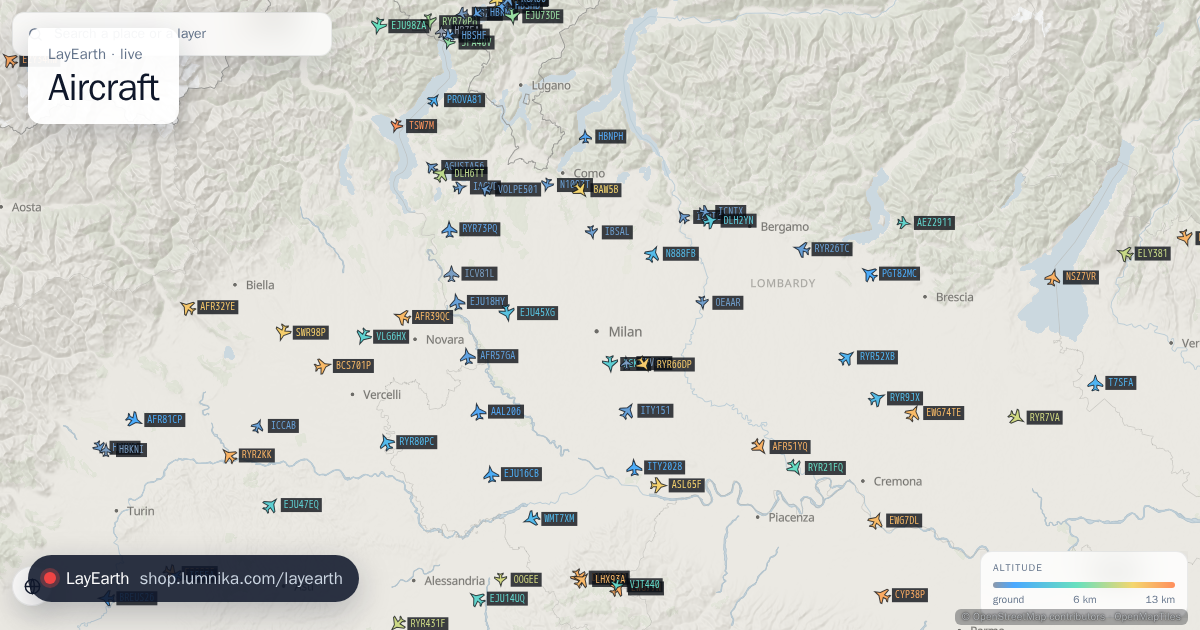 Aircraft
Live aircraft positions over the view, each one dead-reckoned between updates and coloured by altitude.
-
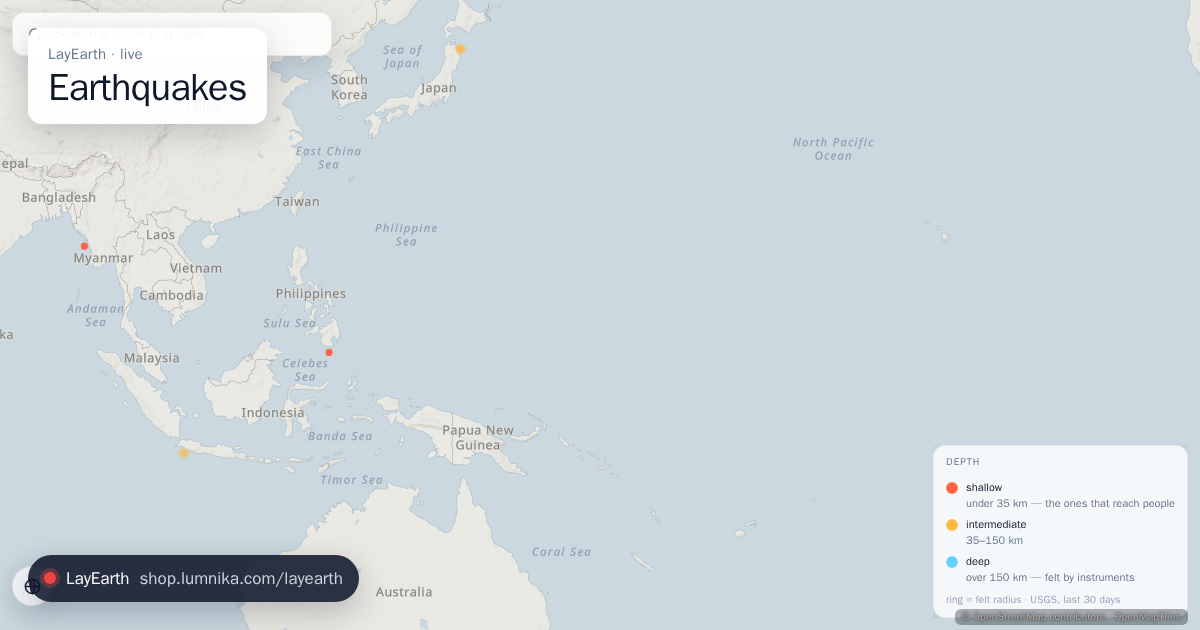 Earthquakes
Every earthquake of magnitude 2.5 or more recorded worldwide in the last 30 days.
-
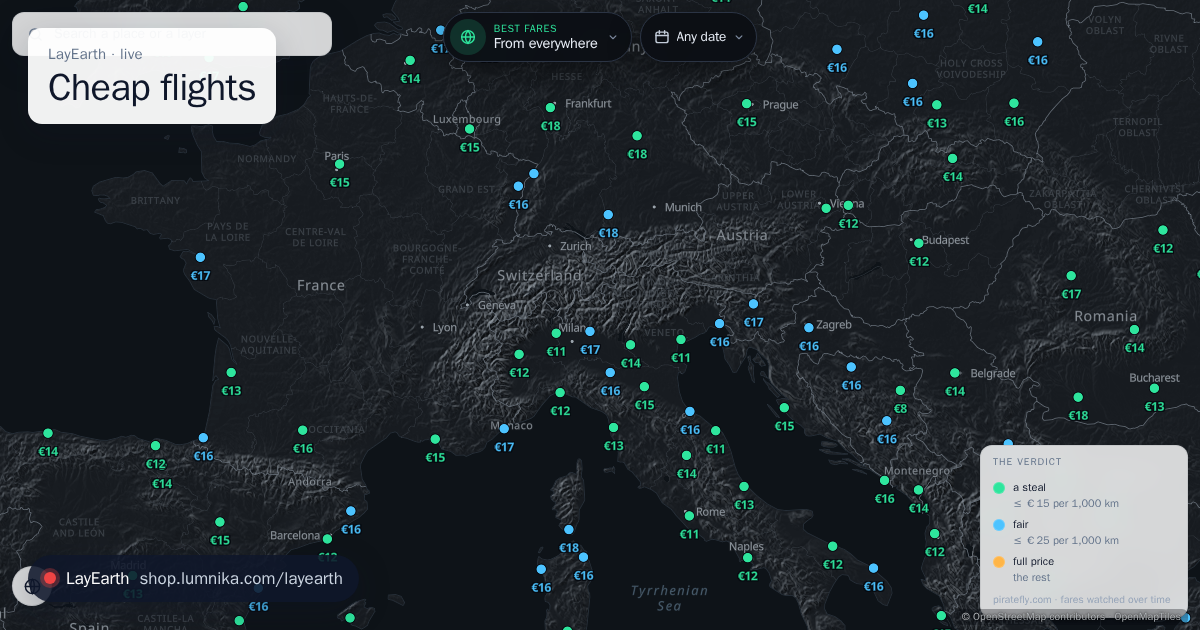 Cheap flights
The lowest fare Piratefly.com is watching to each destination, written as a price on the map.
-
 Active fires
Every active fire detected from orbit in the last 24 hours.
-
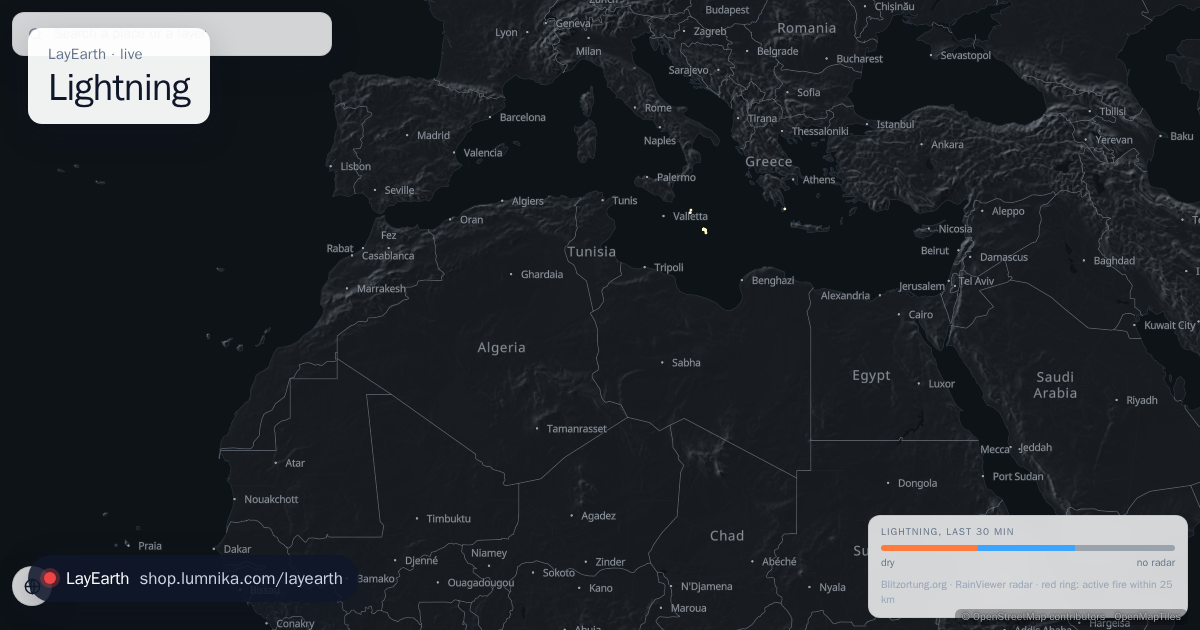 Lightning
Every lightning strike on Earth in the last half hour, as the community network hears it, each ~11 km cell marked dry or wet from the latest weather radar frame.
-
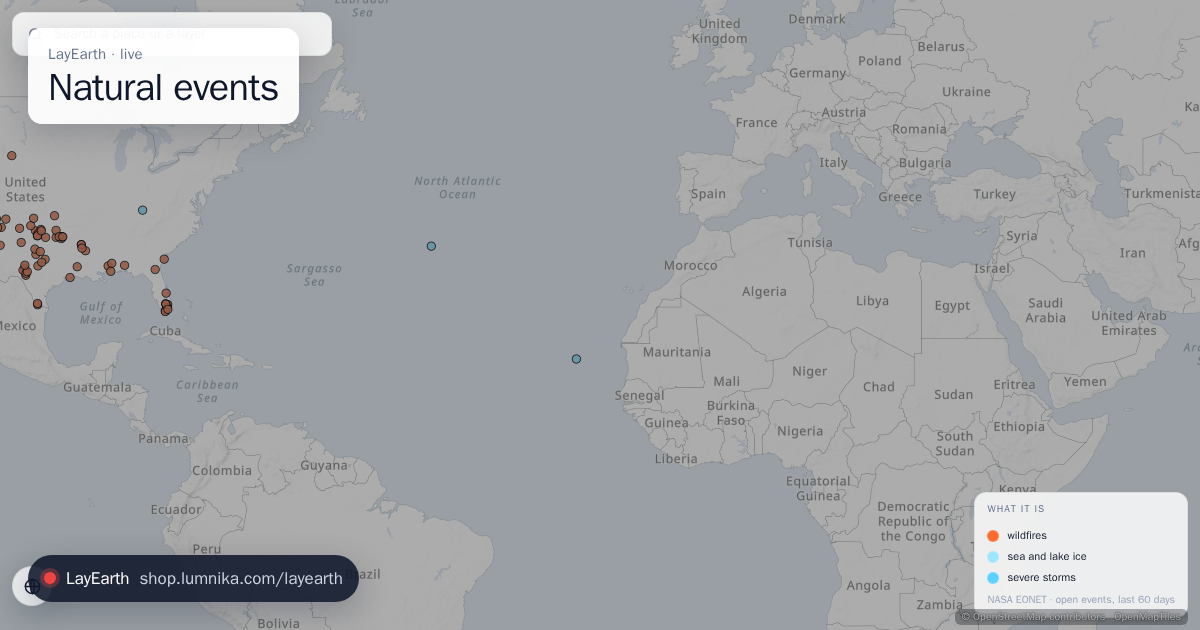 Natural events
 currently open in NASA's curated index: wildfires, volcanoes, severe storms, sea and lake ice and more.
-
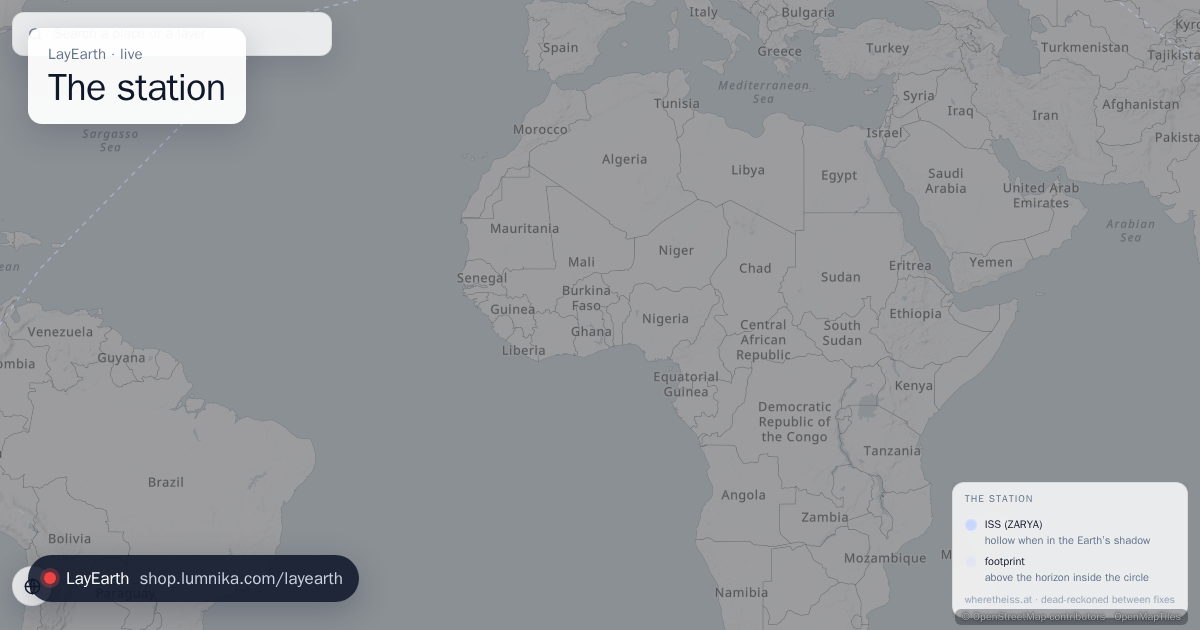 The station
Where the International Space Station is now, where it is heading, and the area of Earth that can see it.
-
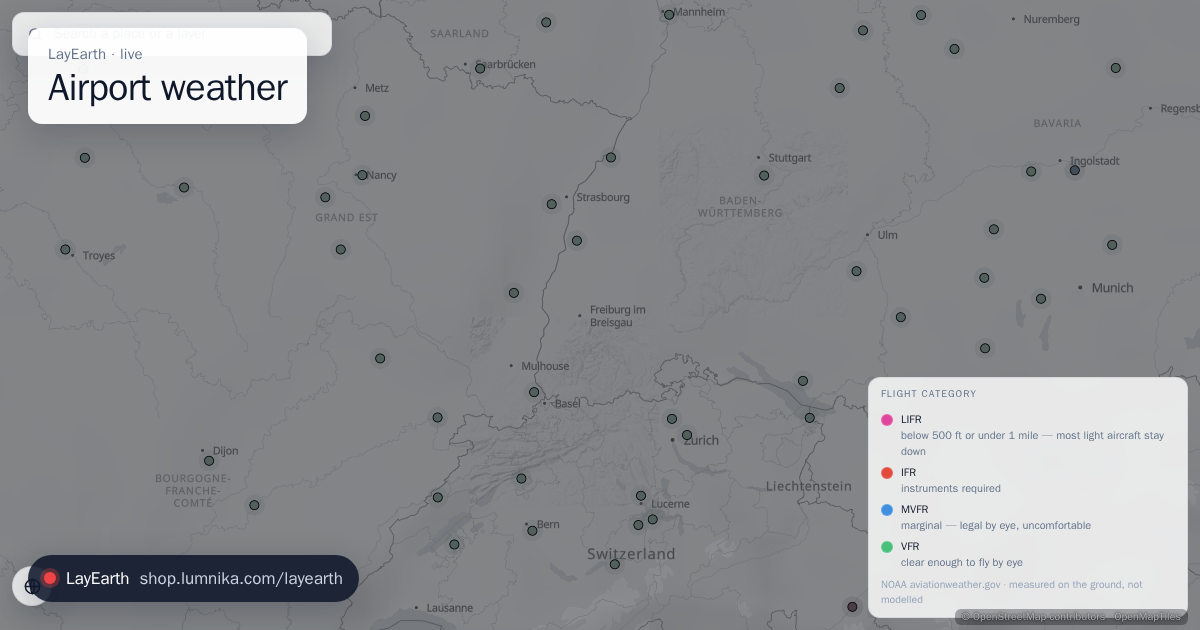 Airport weather
Measured weather at airports, from the METAR reports their instruments send.
-
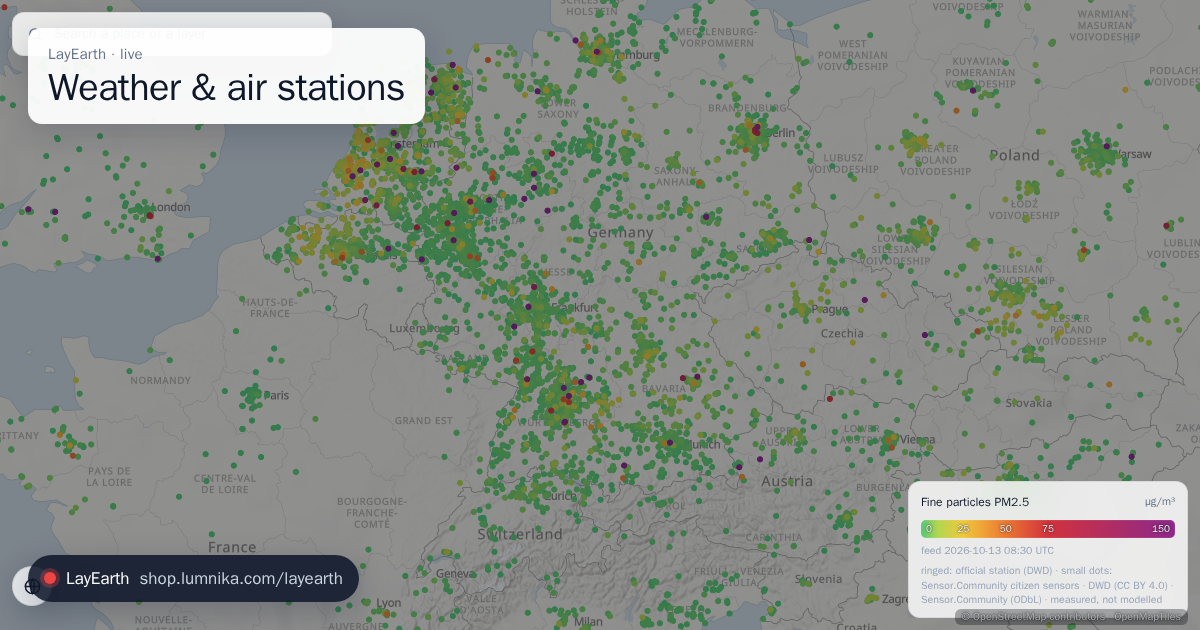 Weather & air stations
Measured weather and air quality at ground stations, from the last hour.
weather · the model over the view
-
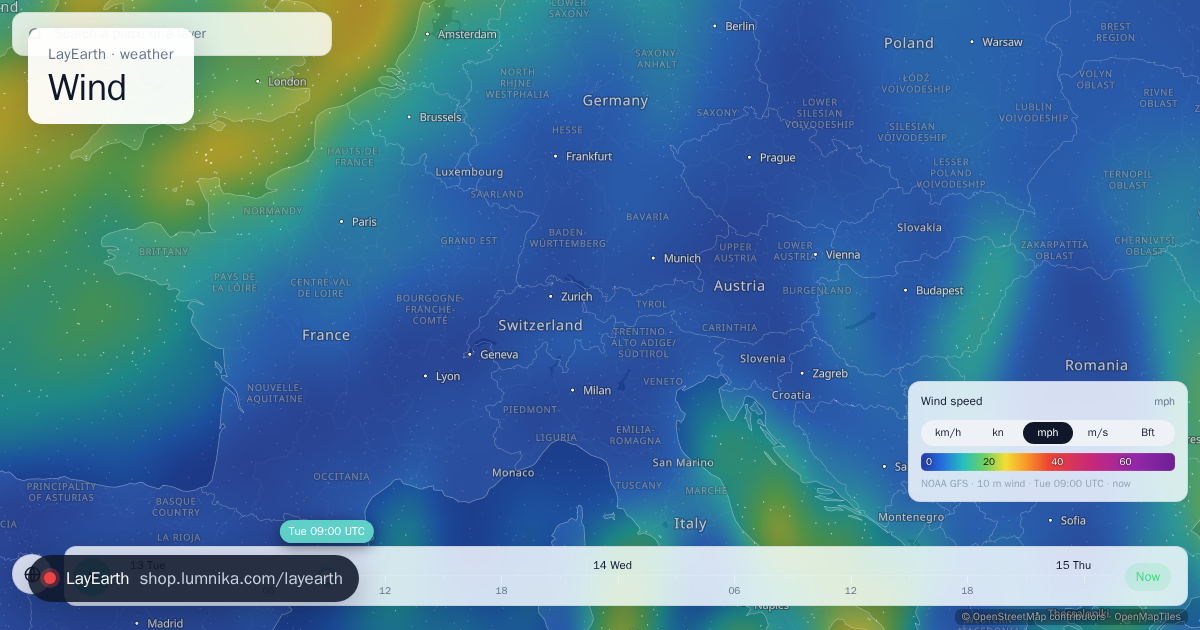 Wind
Surface wind as a streaming particle field, so fronts, convergence lines and storms show up as shapes.
-
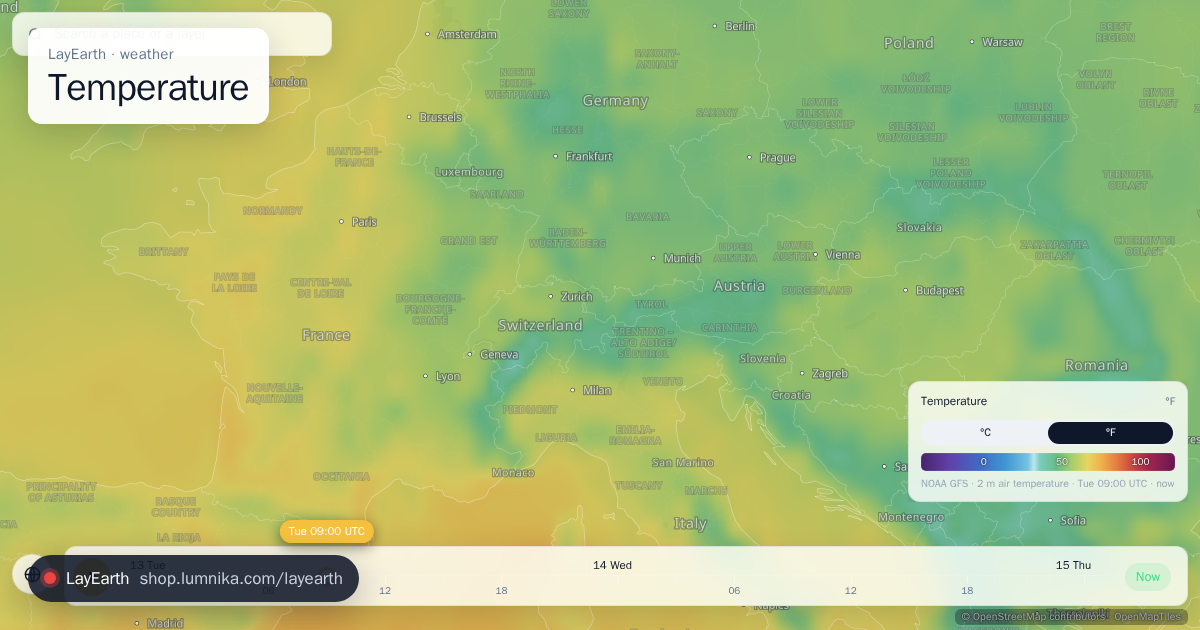 Temperature
Air temperature 2 m above the ground, drawn as a continuous field over the view.
-
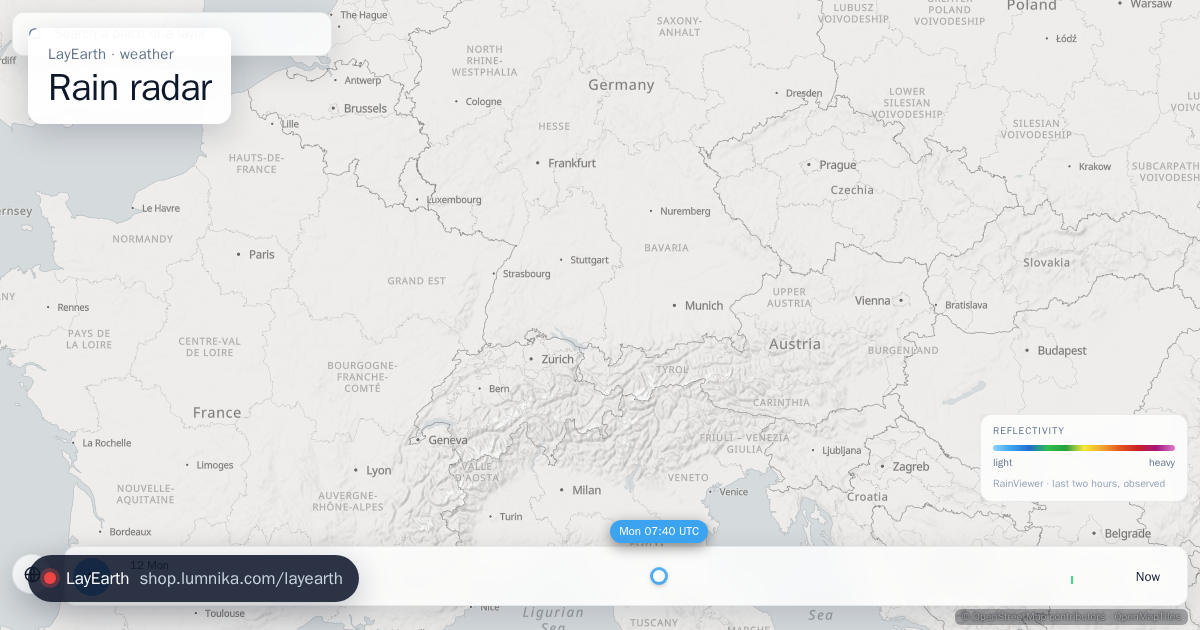 Rain radar
Weather radar for the last two hours, played as a loop.
-
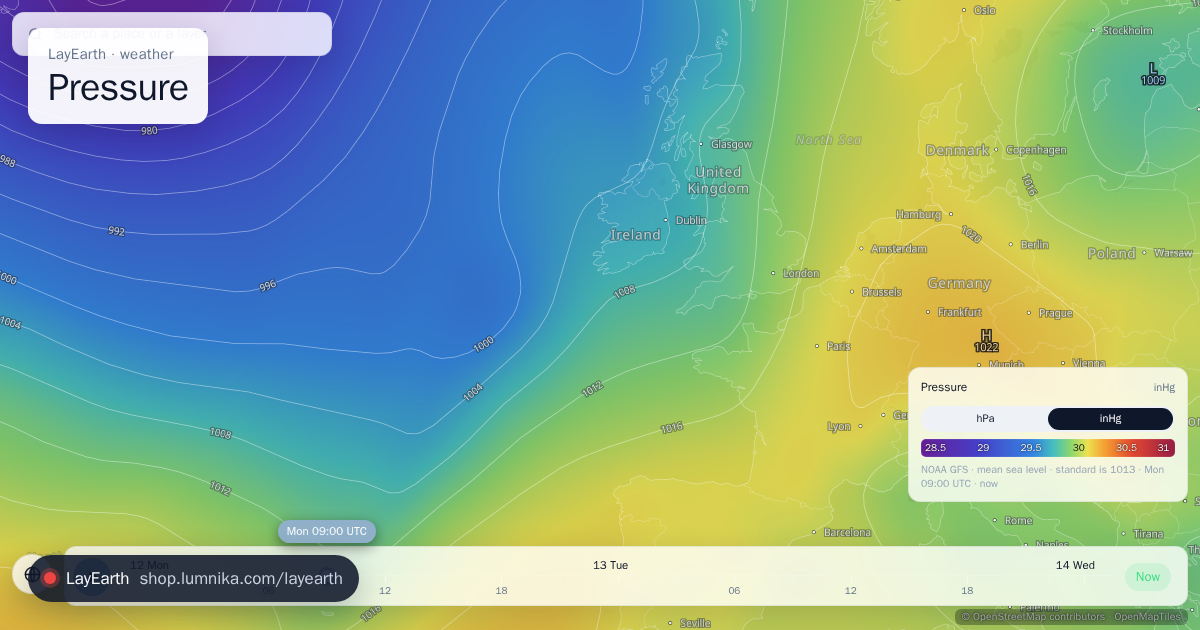 Pressure
Mean sea-level air pressure as a field, which shows where the highs and lows are.
-
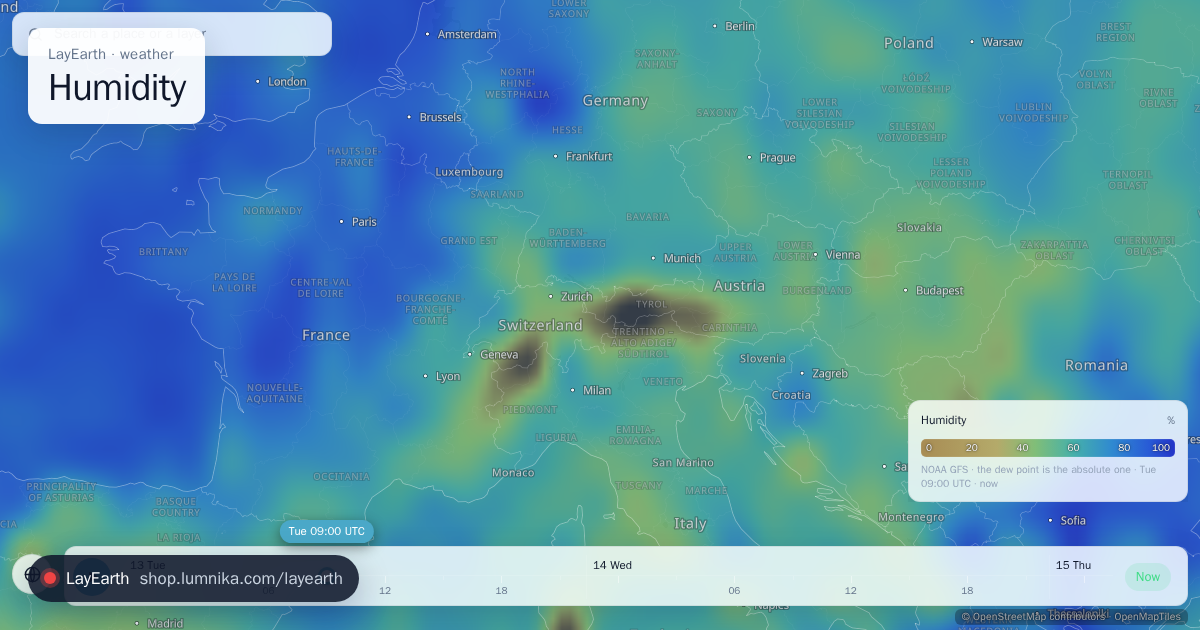 Humidity
Relative humidity 2 m above the ground as a field.
-
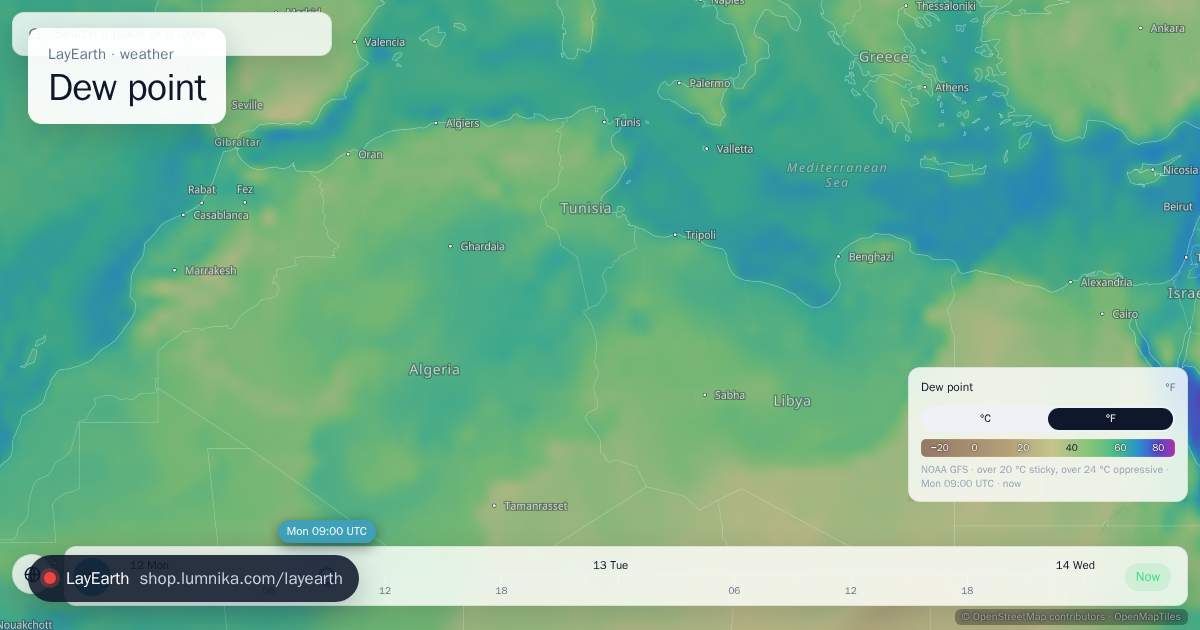 Dew point
 2 m above the ground as a field: the temperature the air must cool to before it condenses, so a direct measure of how much water it holds.
-
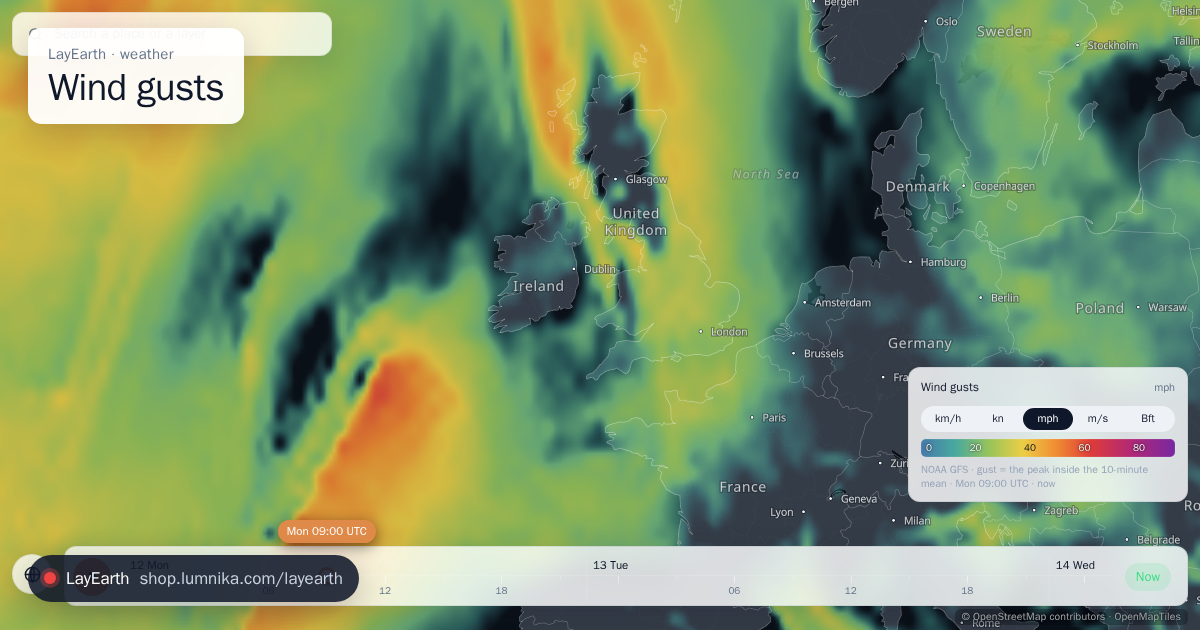 Wind gusts
The peak wind gust 10 m above the ground as a field: the short burst inside the 10-minute mean that damages roofs, trees and vehicles, and the number wind warnings are written in.
-
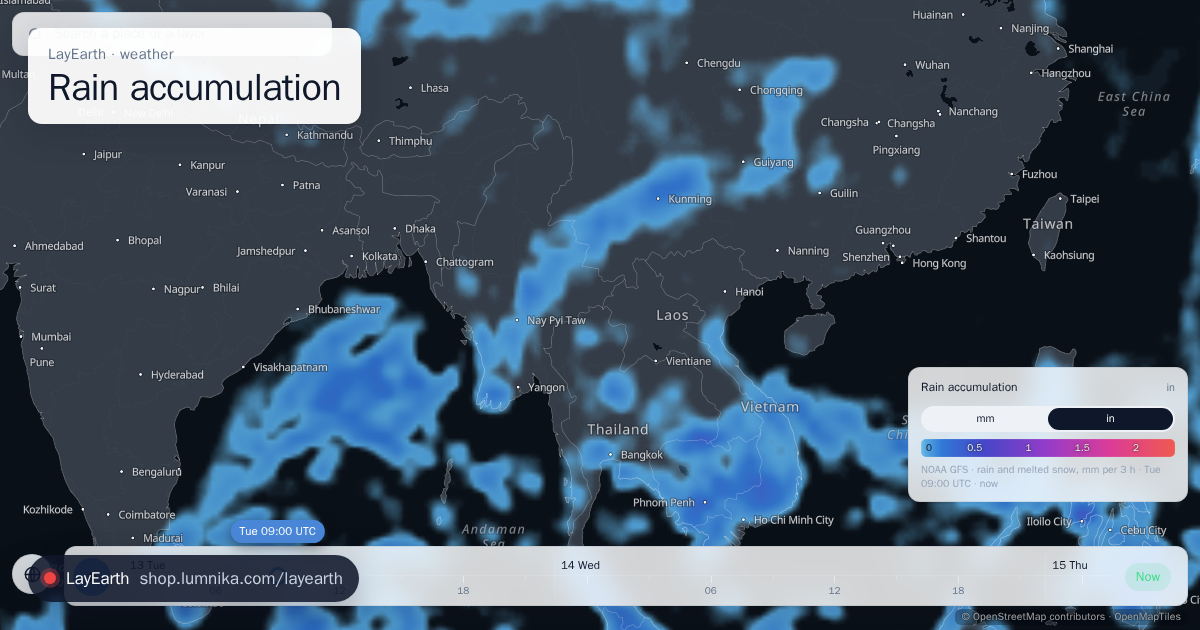 Rain accumulation
Precipitation that fell in the three hours before each frame, rain and the water of melted snow together, worldwide and up to 48 hours ahead where no radar reaches.
-
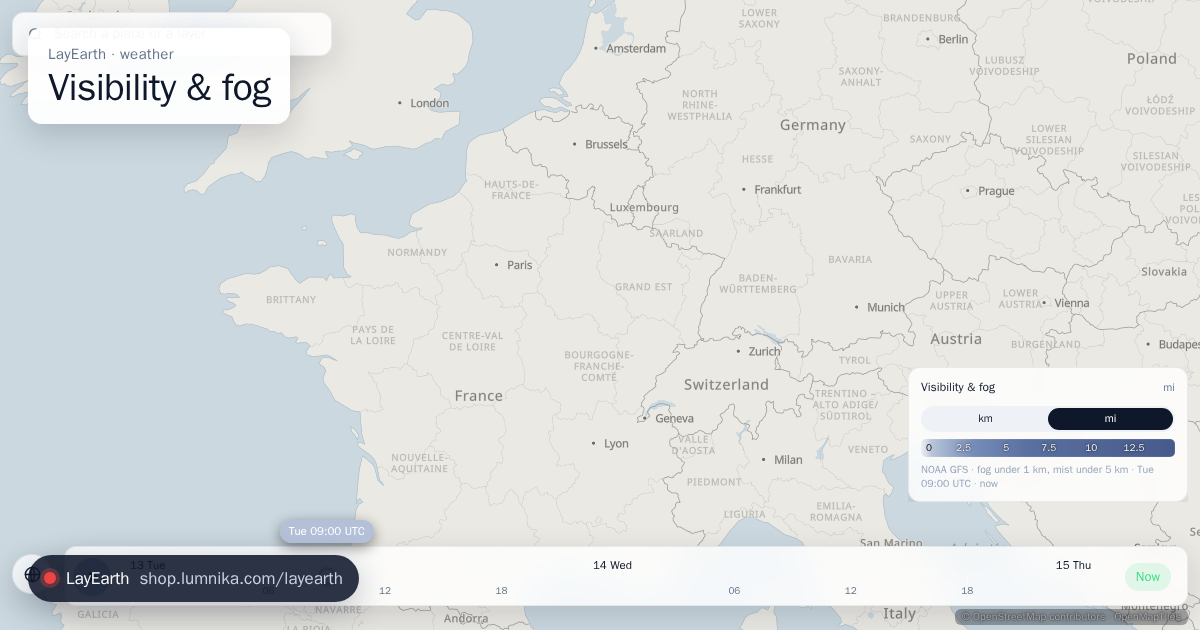 Visibility & fog
Horizontal visibility near the ground as a field, drawn the other way round: clear air shows the map and the colour gathers where the view closes.
-
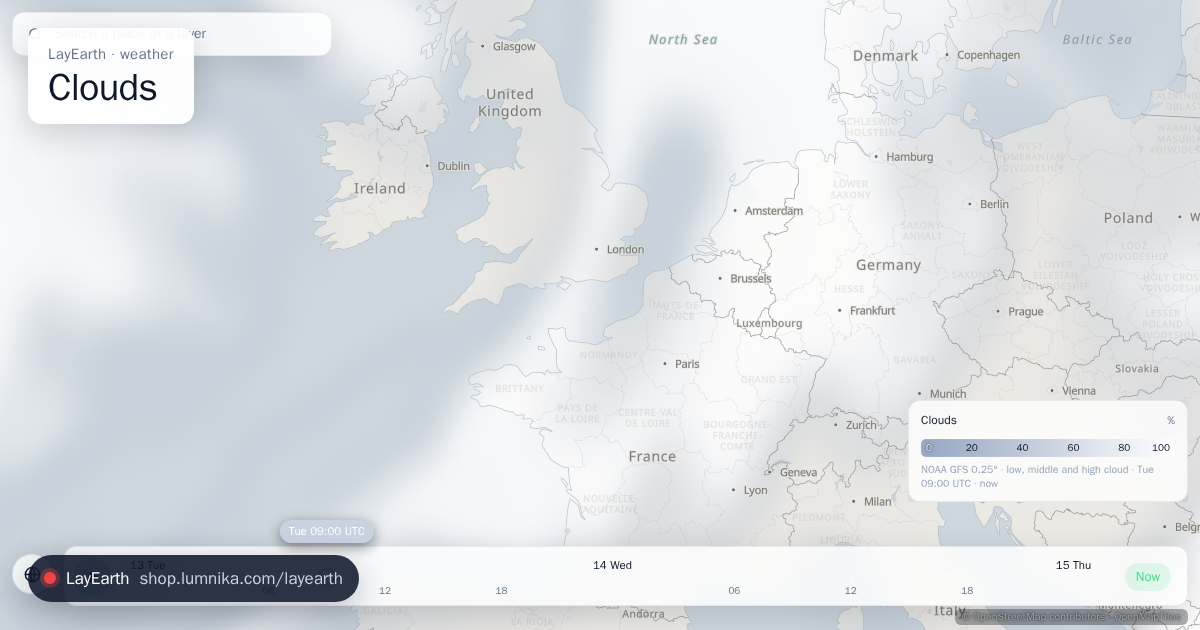 Clouds
Cloud cover as a field, split the way the model splits the sky: total, low (below about 2 km), middle (about 2 to 6 km) and high (above).
-
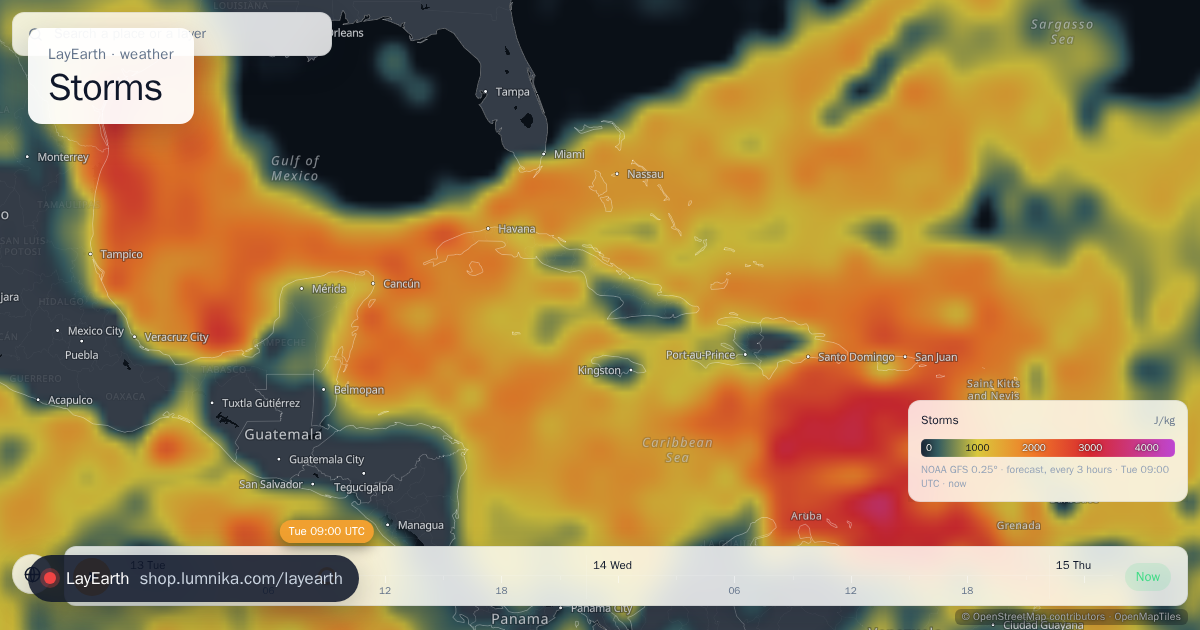 Storms
Where thunderstorms can grow over the next days, and what will fall.
-
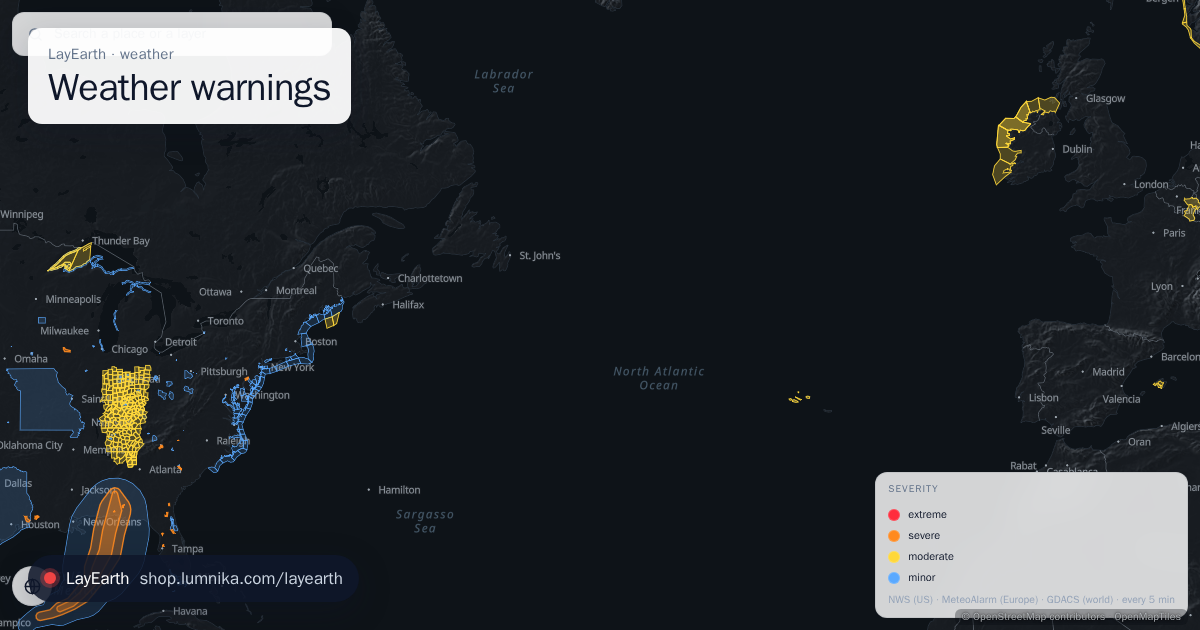 Weather warnings
The official weather warnings in force now, drawn on the areas they were issued for: every watch, warning and advisory of the US National Weather Service, the yellow, orange and red warnings of the European national weather services through MeteoAlarm, and the tropical cyclones and floods GDACS rates worldwide.
-
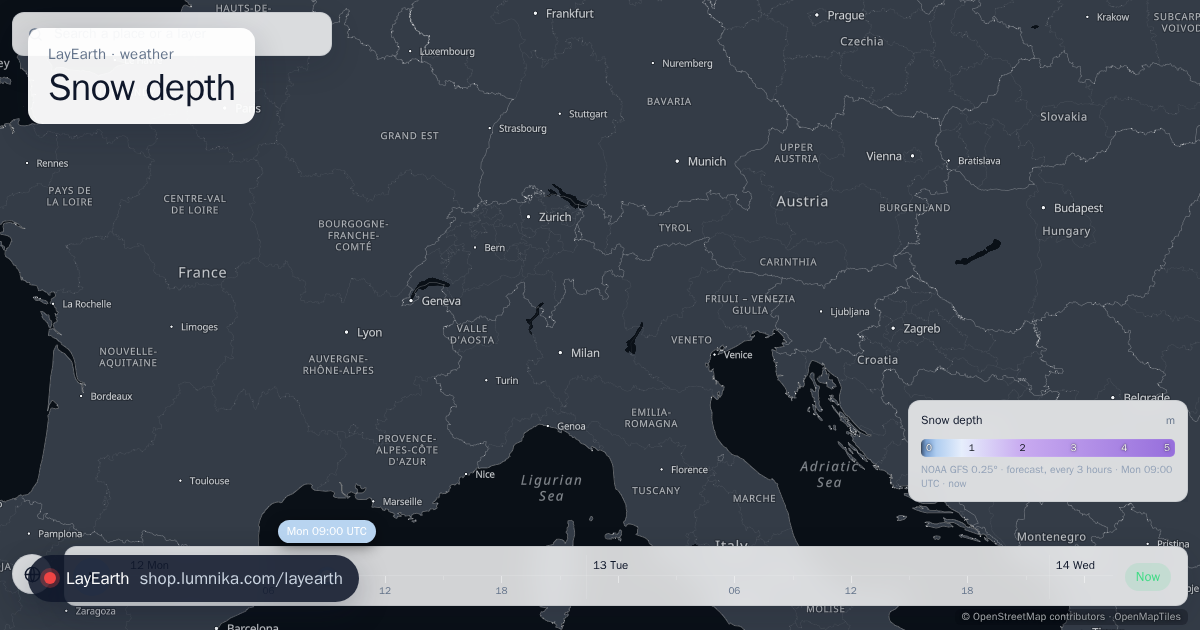 Snow depth
How deep the snow lies on the ground, now and every 3 hours over the next days, so a coming snowfall or a thaw shows as it builds.
-
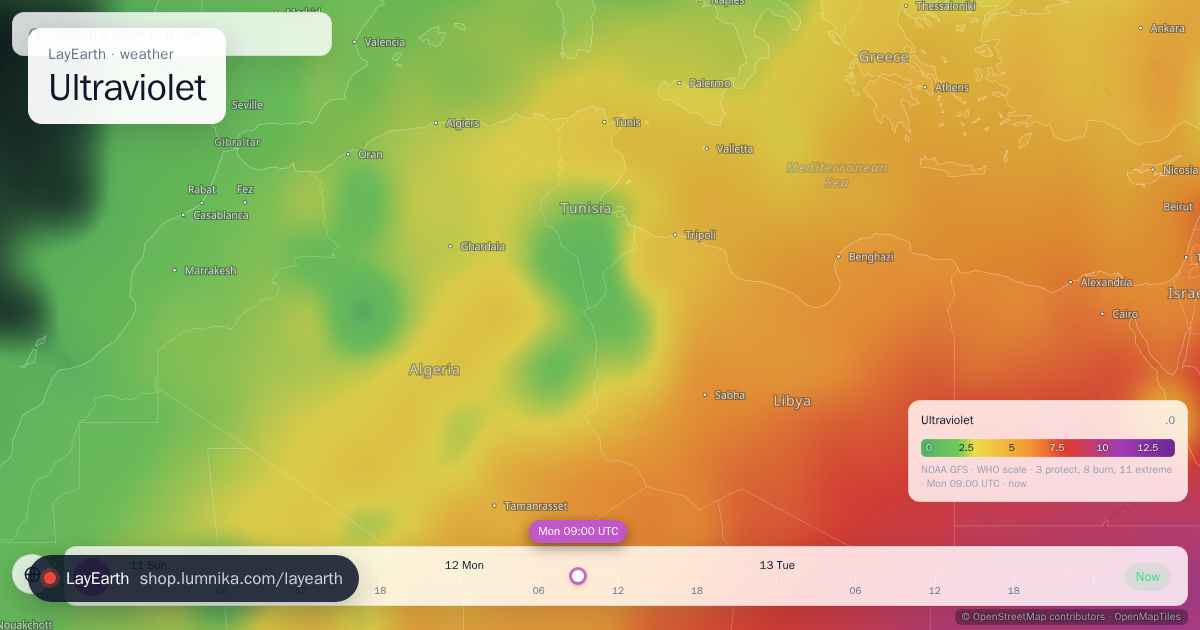 Ultraviolet
The ultraviolet index now, the measure that sunburn follows (temperature does not).
-
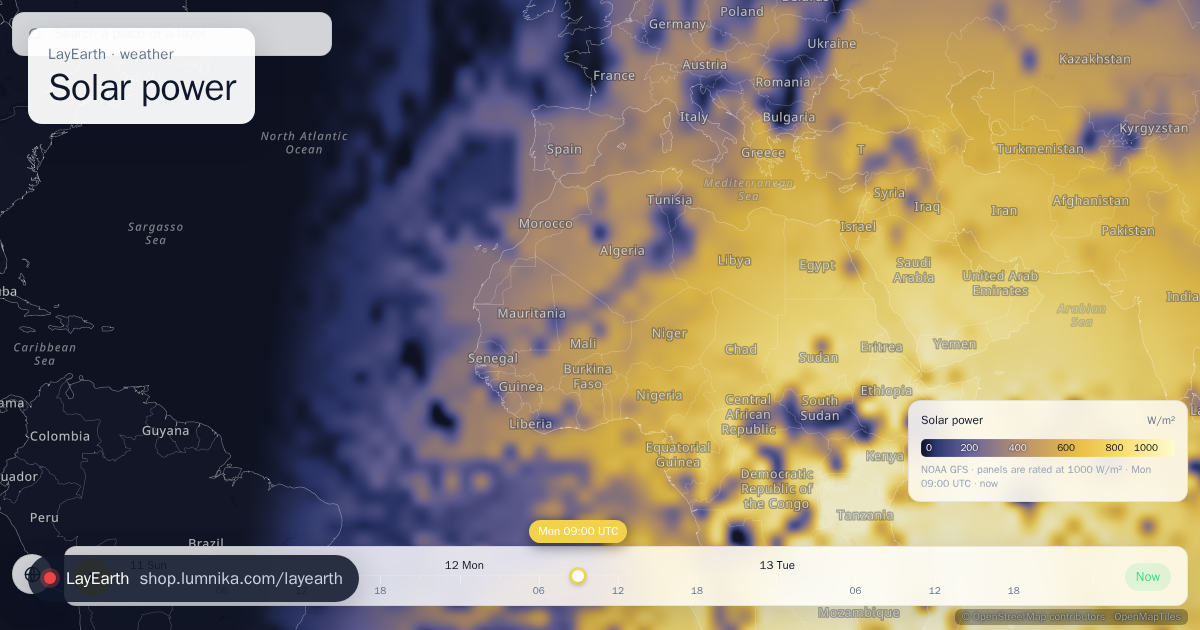 Solar power
Shortwave solar radiation reaching the ground now, which is what a photovoltaic panel converts.
-
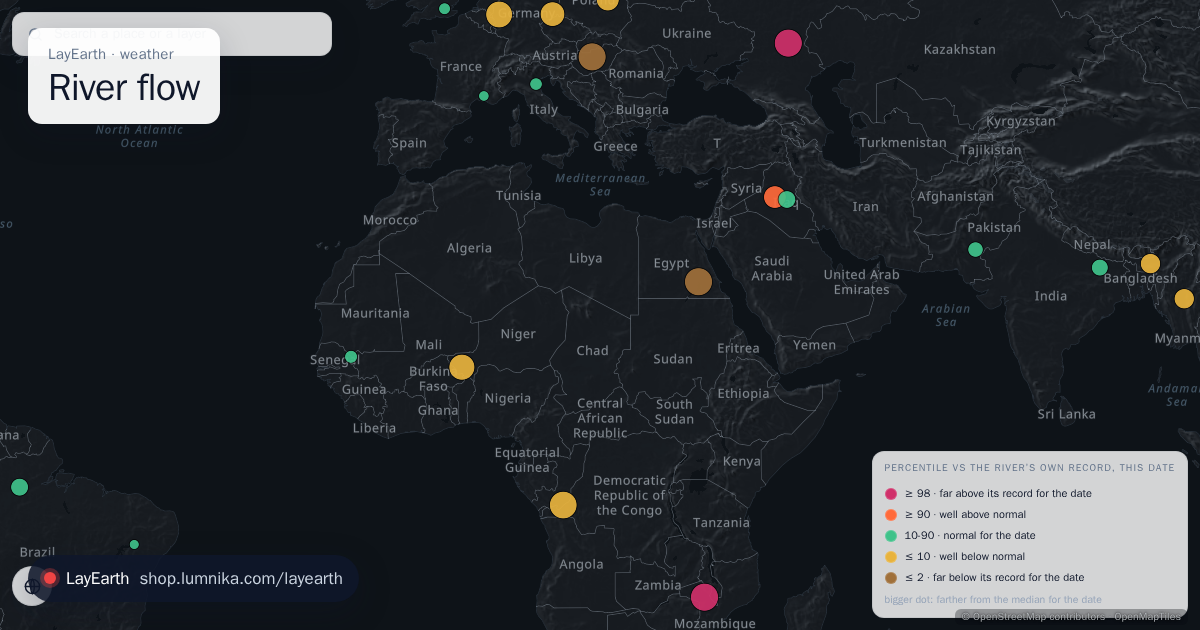 River flow
Is this river running unusually high or low for today's date, against its own record? GloFAS gives every river on Earth a daily discharge, but a number in cubic metres says nothing on its own: a river's normal June is not its normal December.
-
 Soil moisture
Water in the ground as a field: the top 10 cm drawn on the map, the 10-40 cm root layer and the 40-100 cm reserve beside it at the cursor.
-
 Wet-bulb temperature
 2 m above the ground as a field: the coolest a wet, sweating body can get in this air, so heat and humidity read as one number of danger.
sea · waves, temperature and ice
-
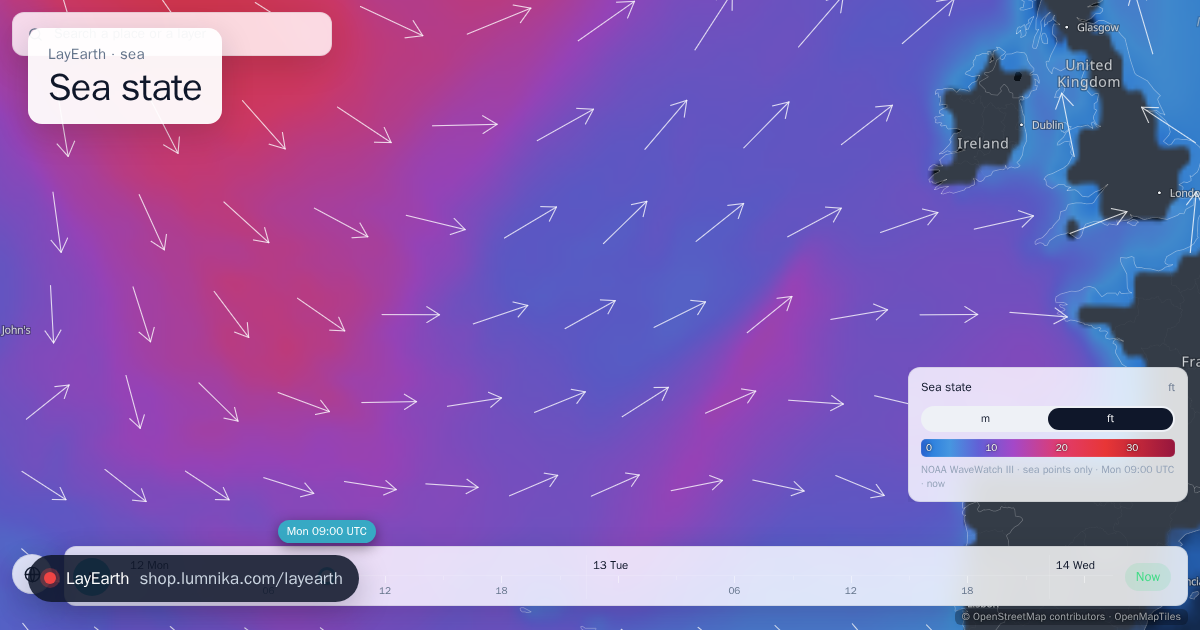 Sea state
Significant wave height over the seas and oceans.
-
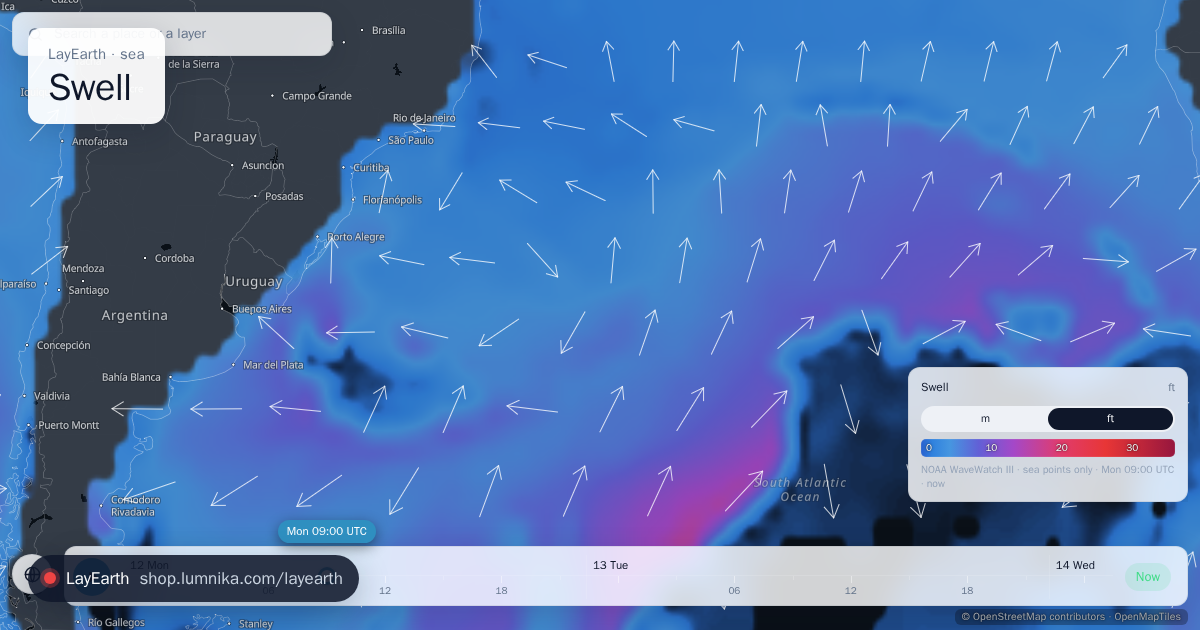 Swell
The primary swell as a field: the long, regular waves that travelled in from a distant storm, apart from the local wind sea.
-
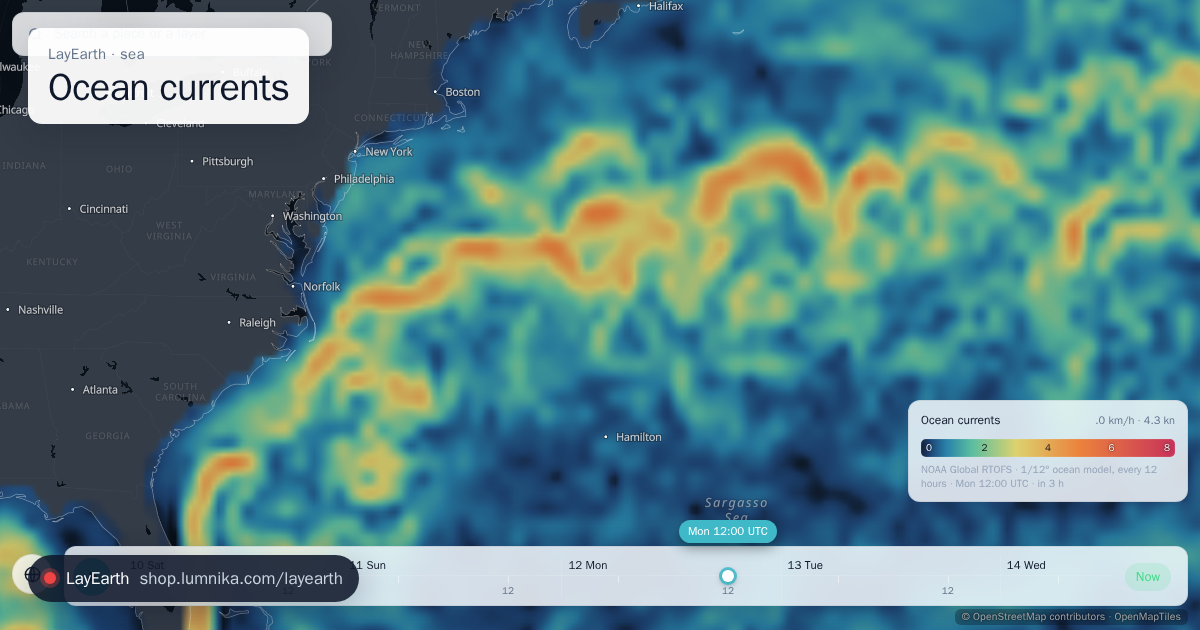 Ocean currents
Where the sea surface is flowing and how fast, from a day ago to three days ahead: the Gulf Stream, the Kuroshio, the Agulhas and the eddies they shed, with moving particles along the flow.
-
 Tides
Sea level at the coast, hour by hour from yesterday to three days ahead: the astronomical tide, computed in your browser (the surge from wind and pressure is not included).
-
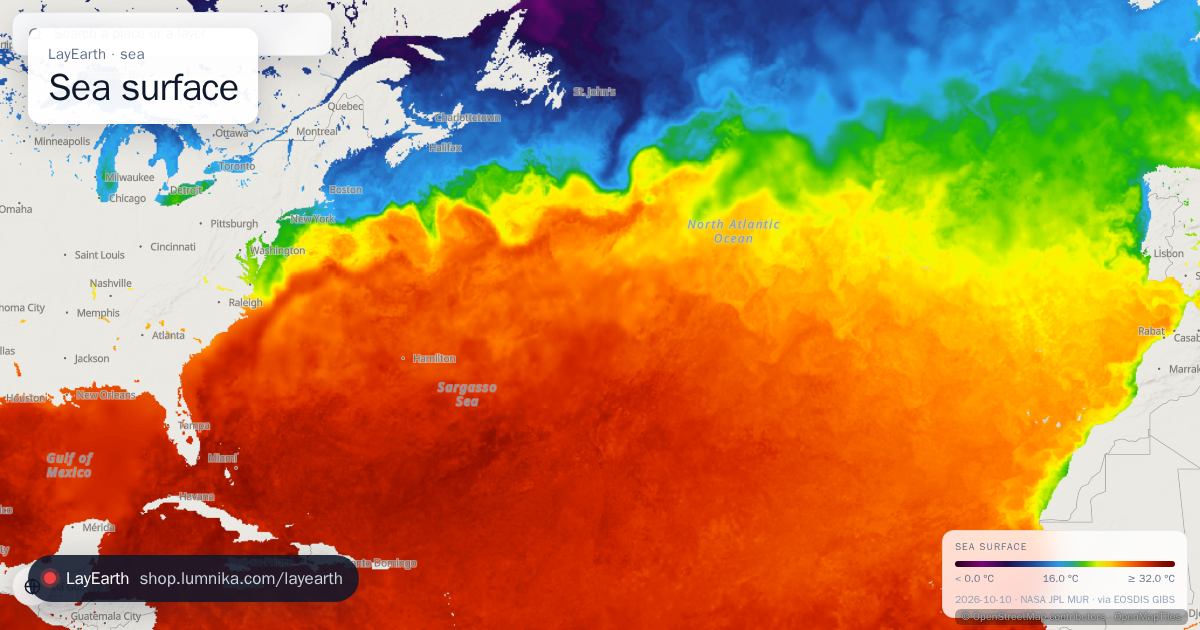 Sea surface
 temperature for any day in the archive, back to 2002.
-
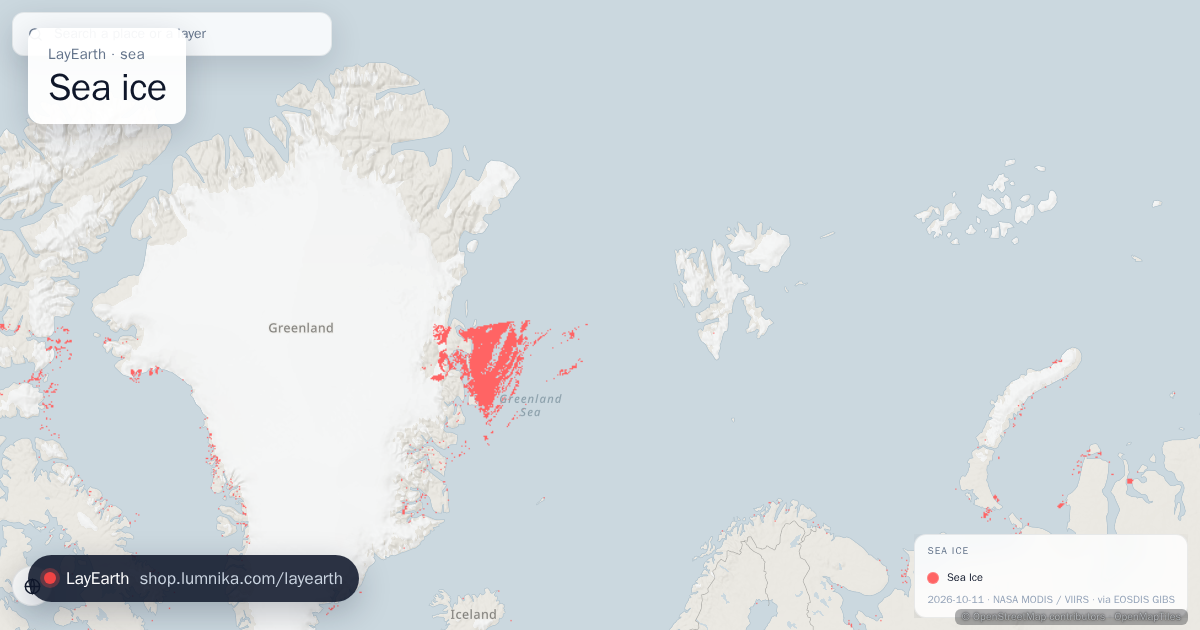 Sea ice
Where the ocean is frozen, as a daily ice / no-ice mask.
-
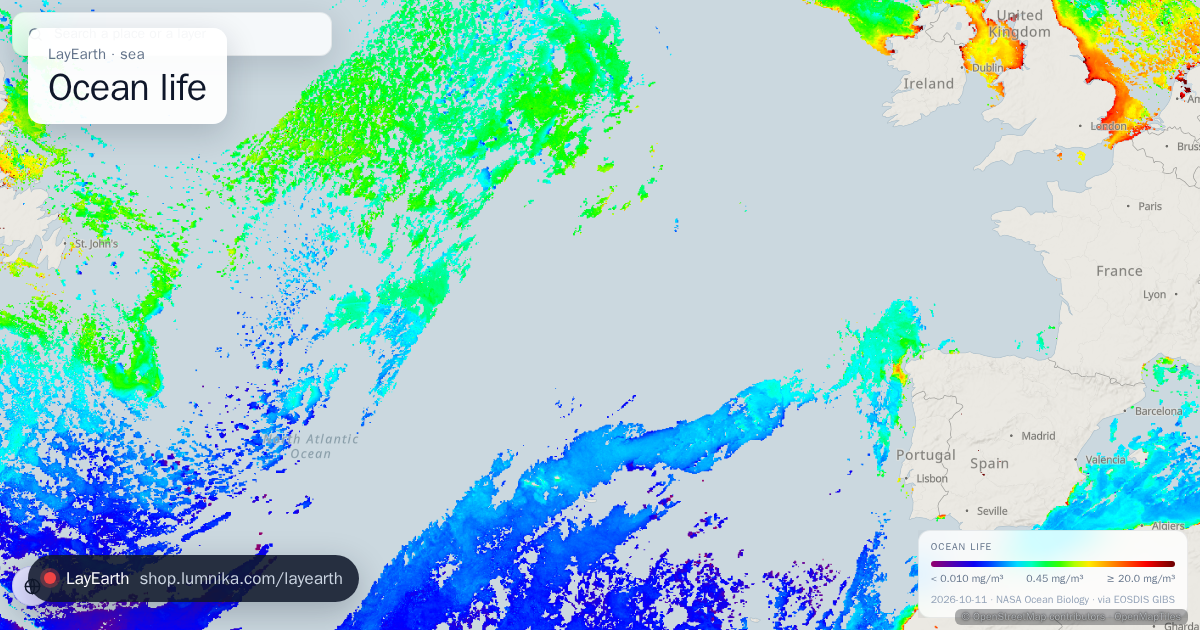 Ocean life
Chlorophyll-a in the surface ocean, the pigment of phytoplankton, which shows where marine life is concentrated.
air · what we breathe
-
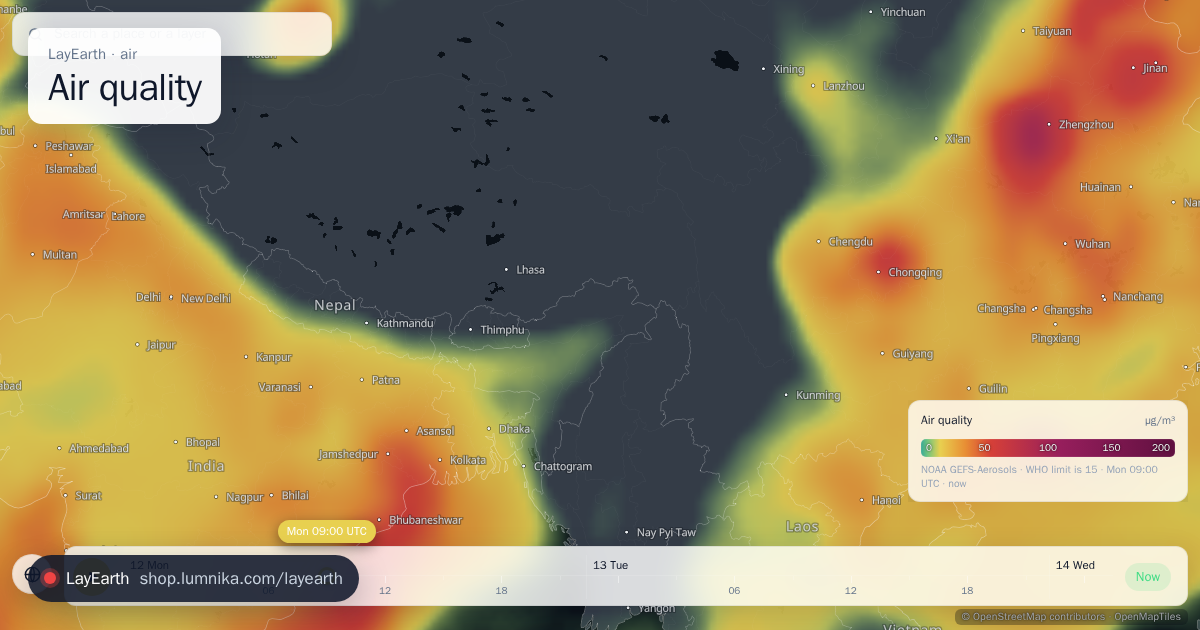 Air quality
Fine particulate matter (PM2.5) as a continuous field rather than a dot per monitoring station.
-
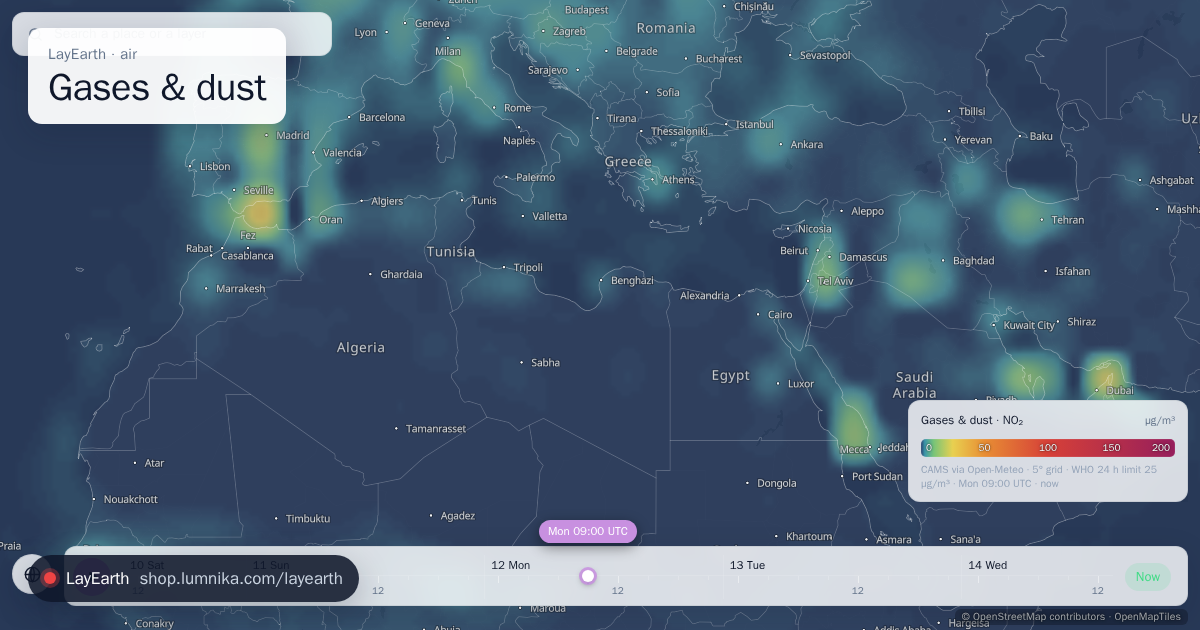 Gases & dust
Six pollutants near the ground as fields, one at a time: nitrogen dioxide (traffic, power plants), ozone (made from them in sunshine, downwind), sulphur dioxide (coal, smelters, volcanoes), carbon monoxide (fires, combustion), PM10 and desert dust.
-
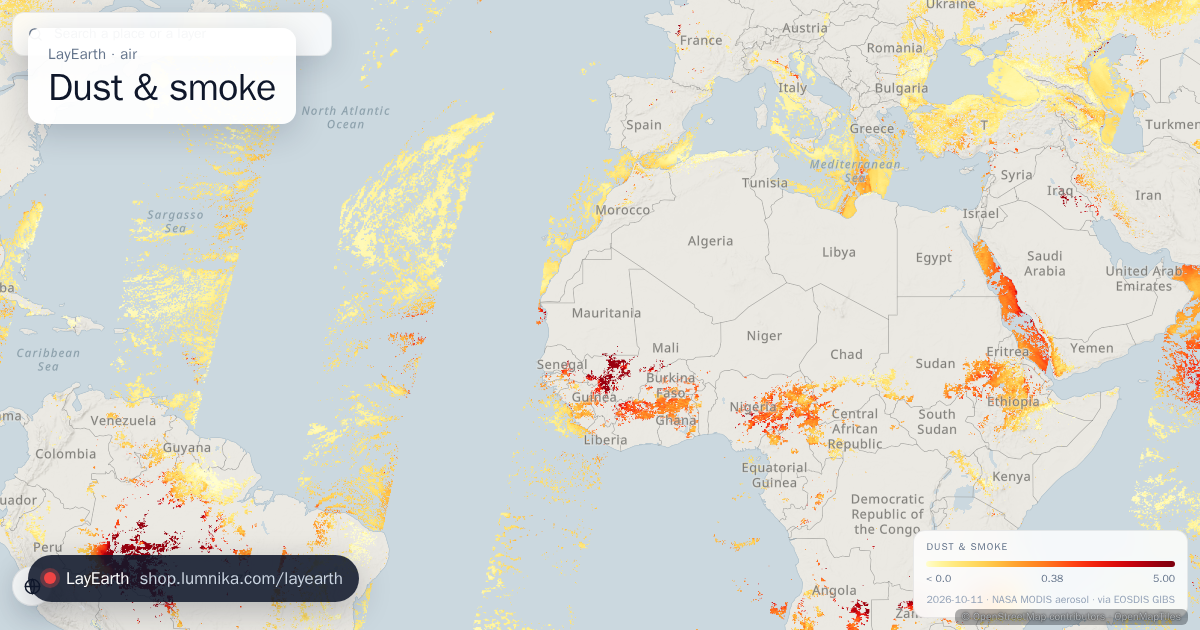 Dust & smoke
Aerosol optical depth: how much dust, smoke and haze is in the whole air column, measured from orbit.
earth · land, orbit, life and sky
-
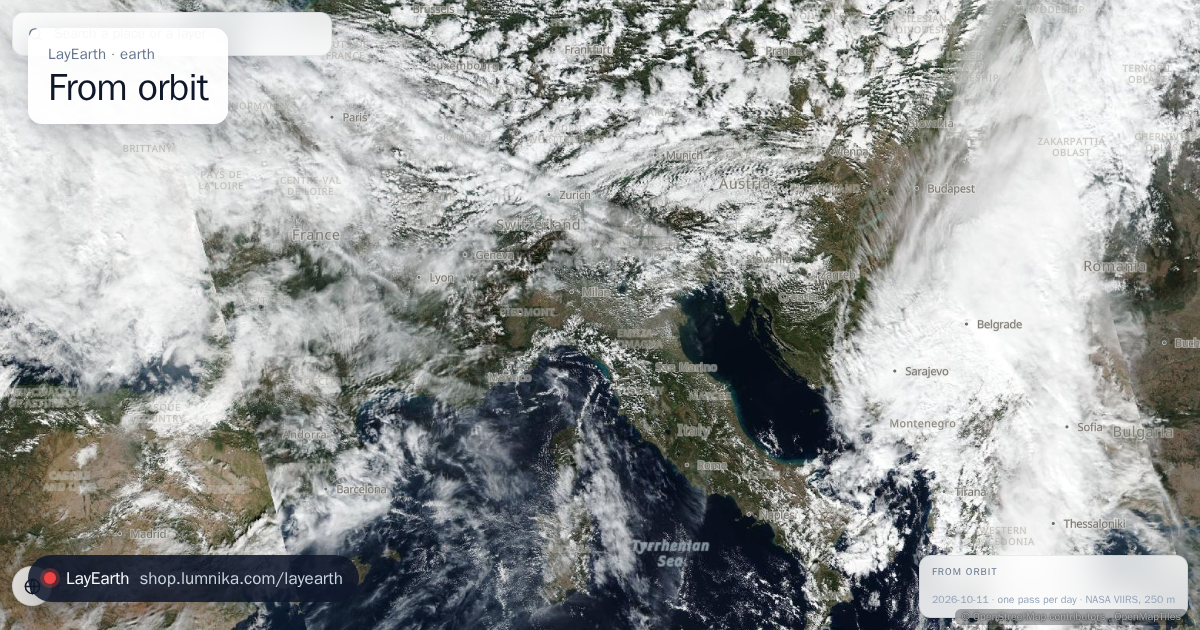 From orbit
The whole planet as photographed by satellite on a single day: a daily corrected-reflectance mosaic, not a drawn basemap.
-
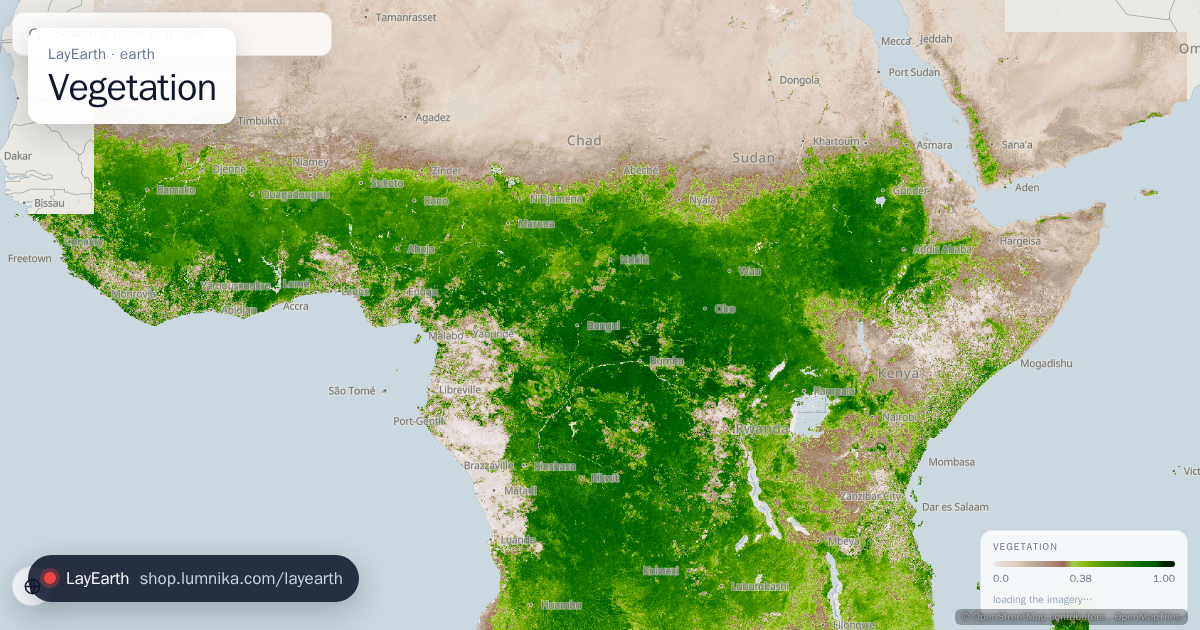 Vegetation
How much living vegetation is on the ground, from satellite vegetation indices.
-
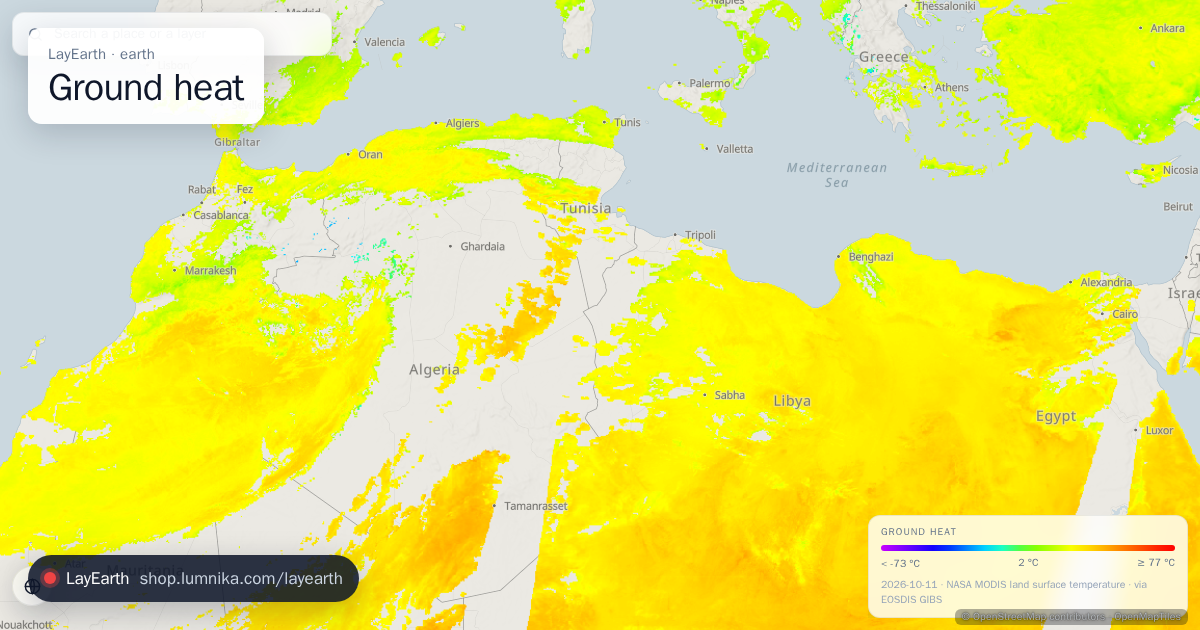 Ground heat
The temperature of the ground surface itself as an infrared radiometer measures it, which can differ from the air temperature by 20 °C or more.
-
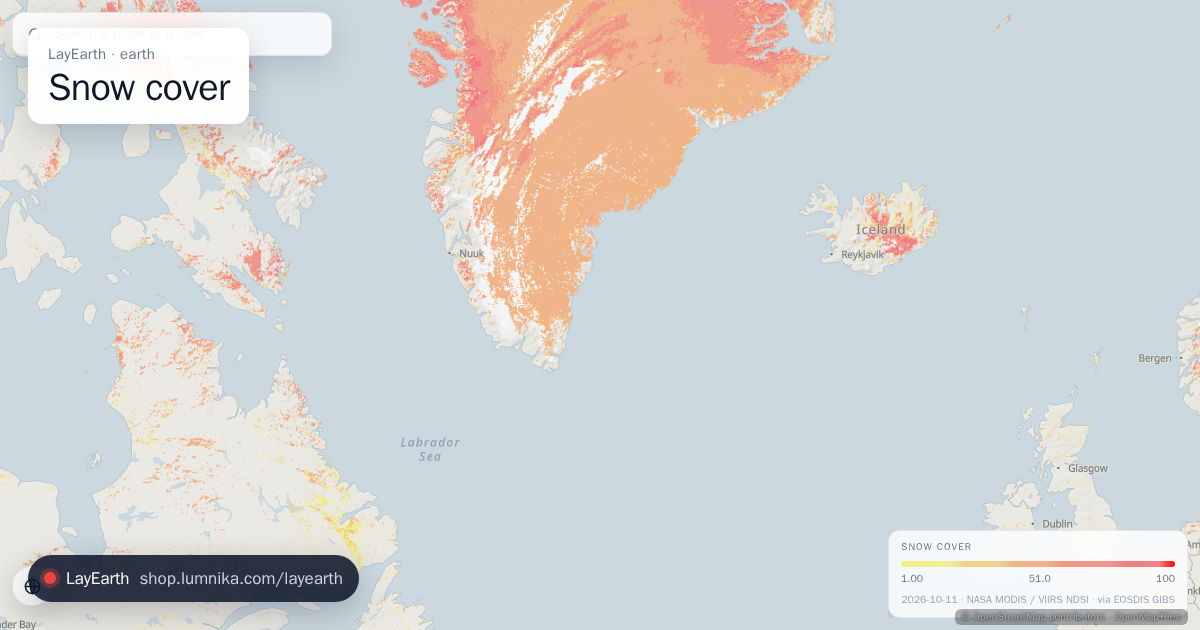 Snow cover
Where there is snow on the ground, mapped with the snow index (NDSI) that tells snow apart from cloud.
-
 Satellite
The last three hours of weather as the geostationary satellites see it, played as a loop: GOES-West, GOES-East, Meteosat and Himawari together cover everything between the polar caps.
-
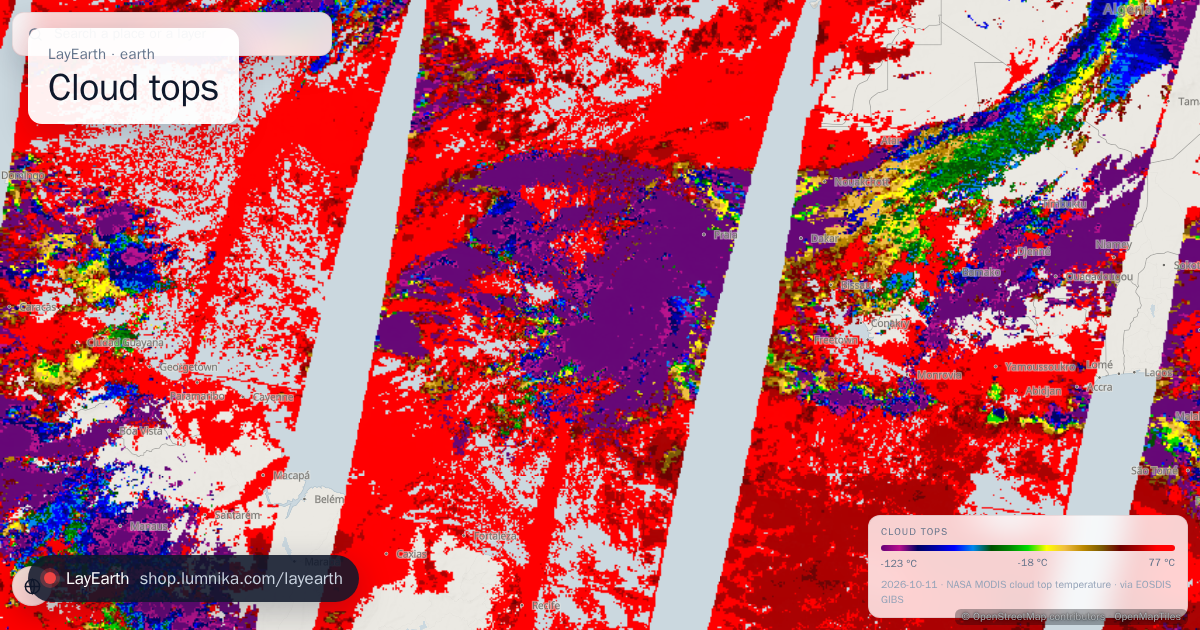 Cloud tops
The temperature at the top of clouds, which stands in for their height: the colder the top, the taller the cloud.
-
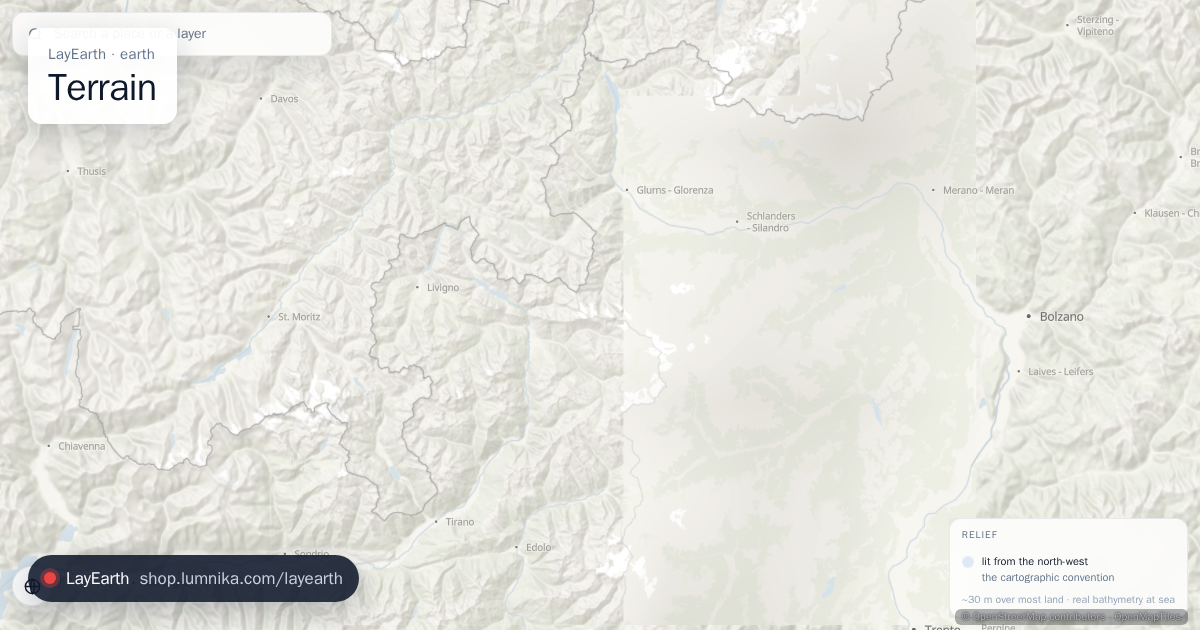 Terrain
Turns the map into a relief model using a height for every pixel.
-
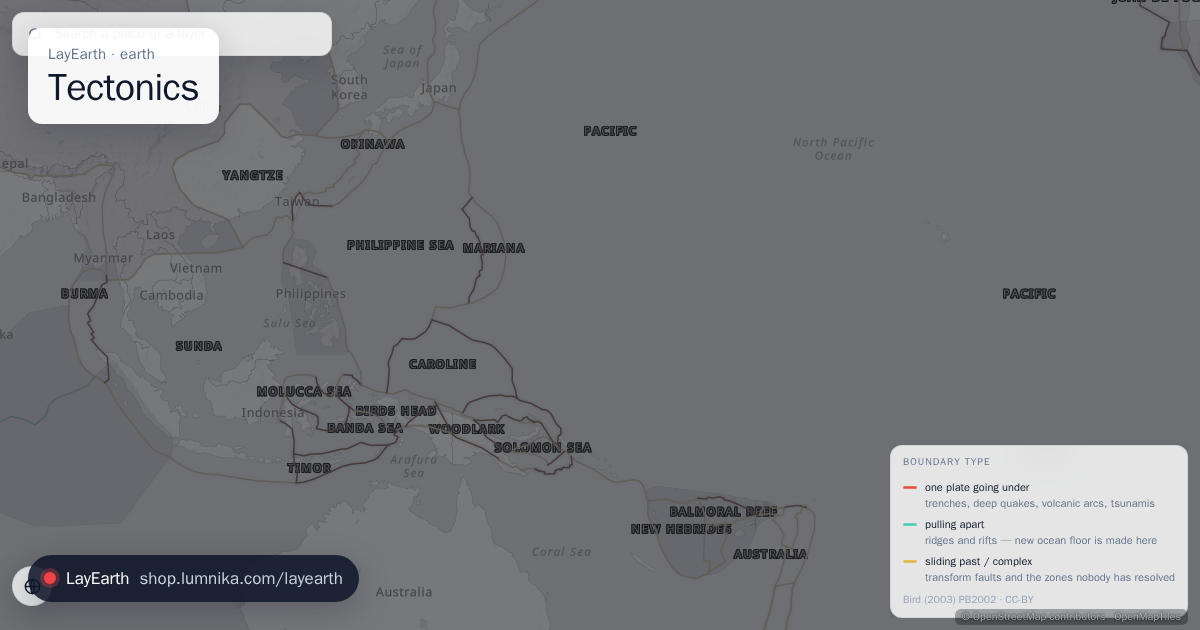 Tectonics
The boundaries of the tectonic plates, coloured by what each boundary does: plates going under one another, pulling apart, or sliding past.
-
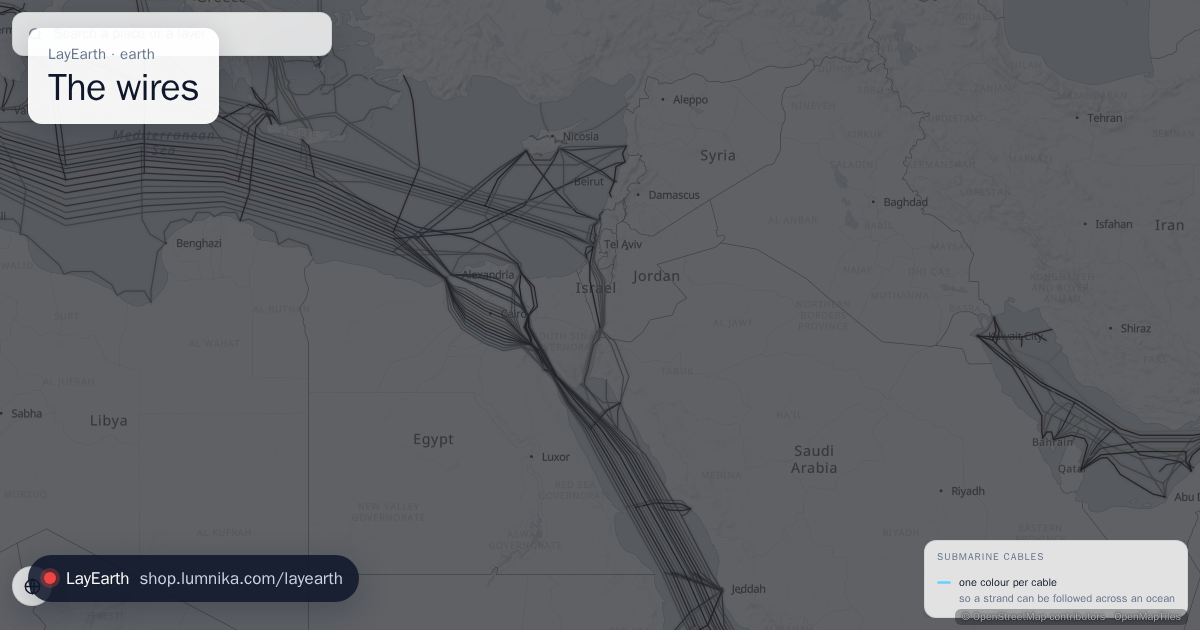 The wires
The submarine fibre-optic cables that carry almost all intercontinental internet traffic.
-
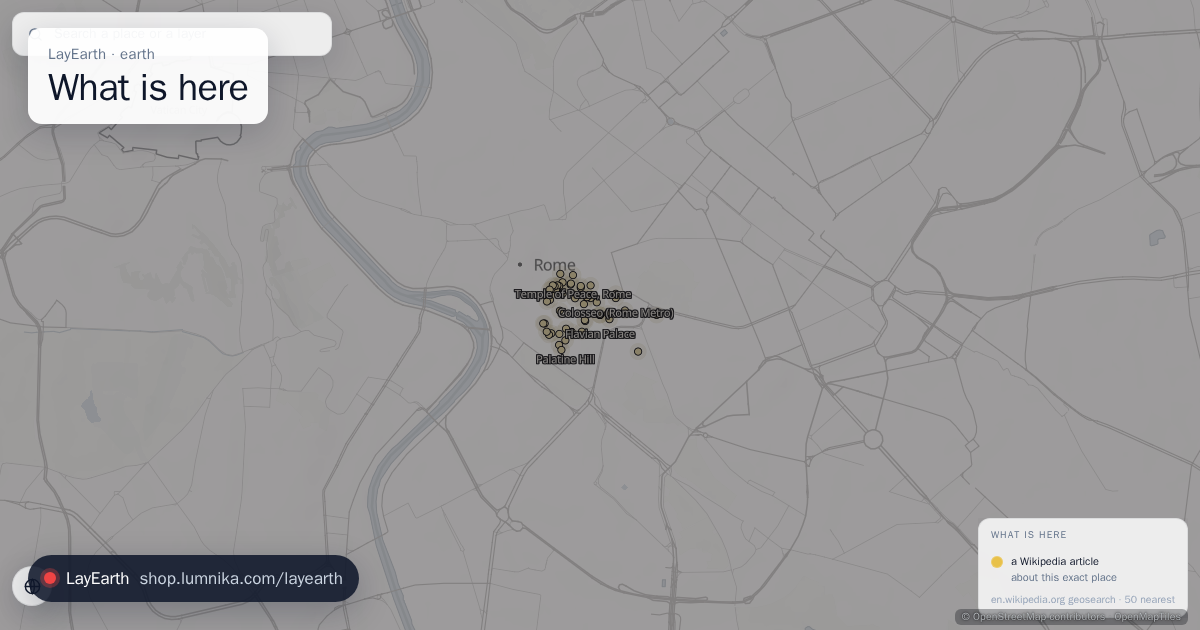 What is here
Wikipedia articles about the places in the current view: battles, buildings, wrecks, volcanoes.
-
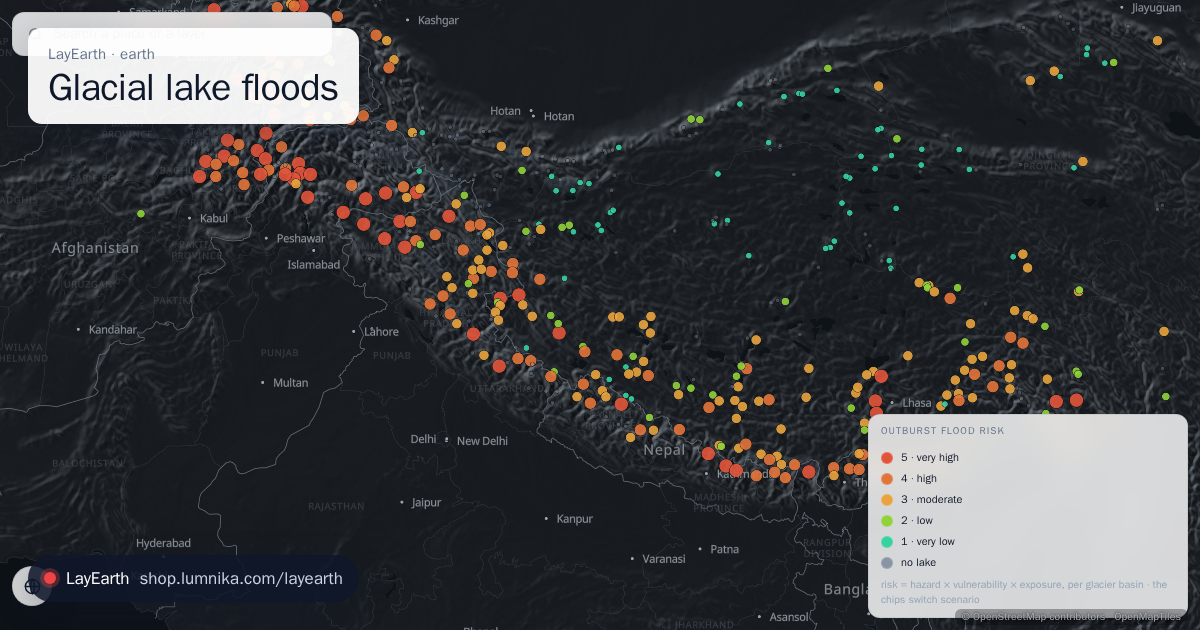 Glacial lake floods
Every glacier basin in the world with a lake that can burst, and how bad the flood below it would be.
-
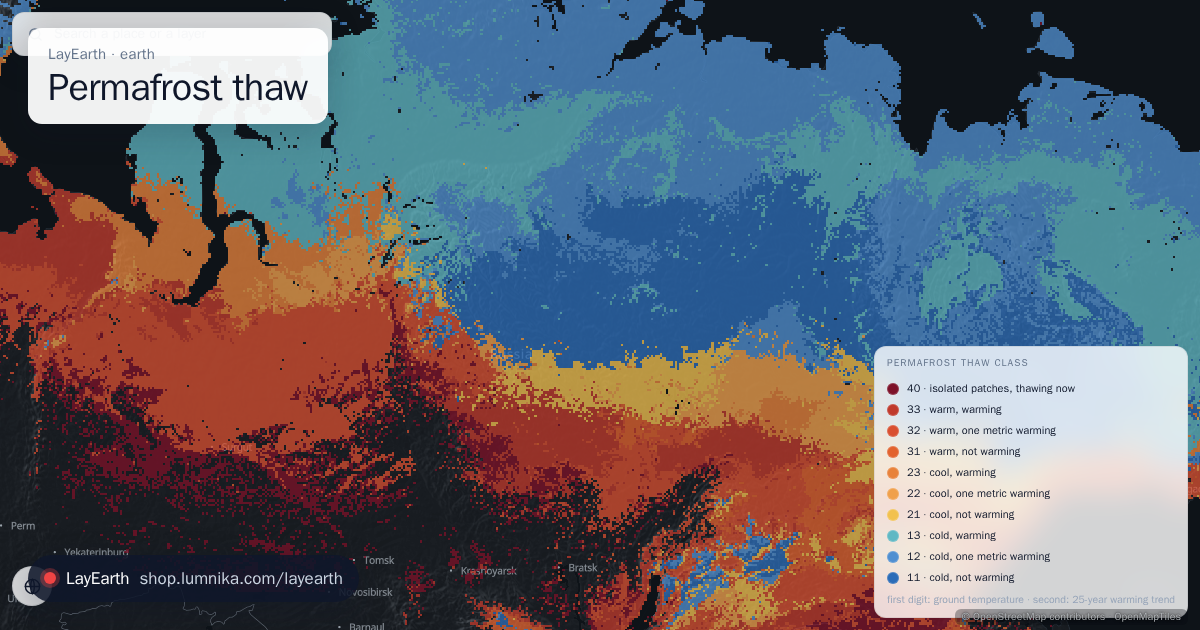 Permafrost thaw
Every road and pipeline on Arctic permafrost, coloured by how fast the ground under it is warming.
-
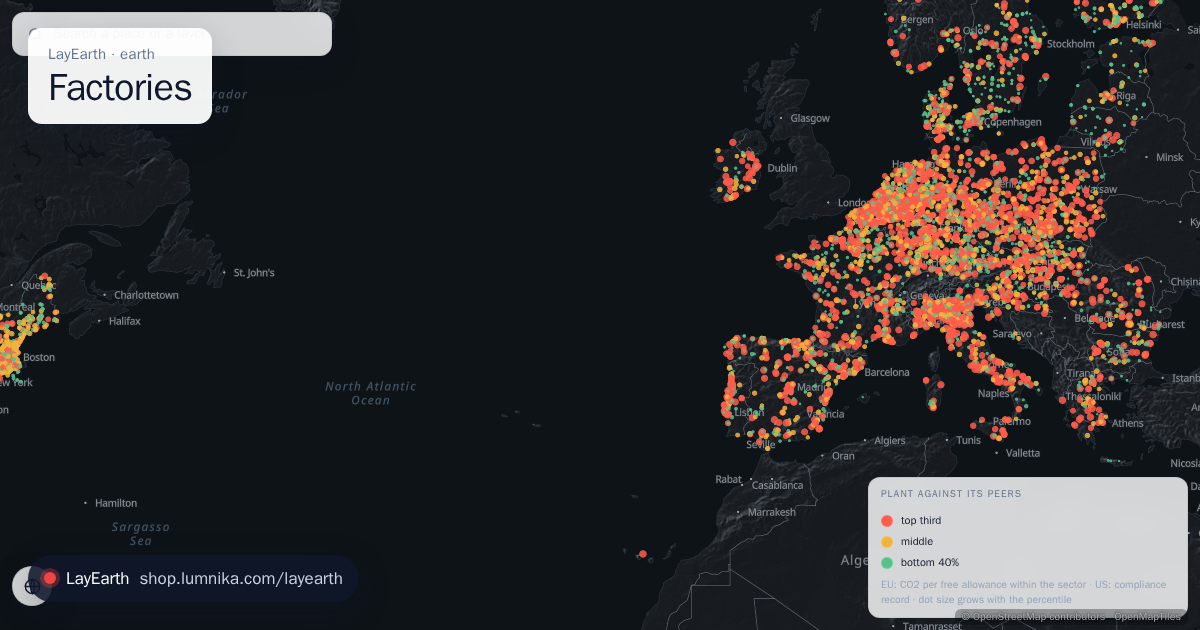 Factories
Every large industrial plant in two public registers, each set against its peers.
-
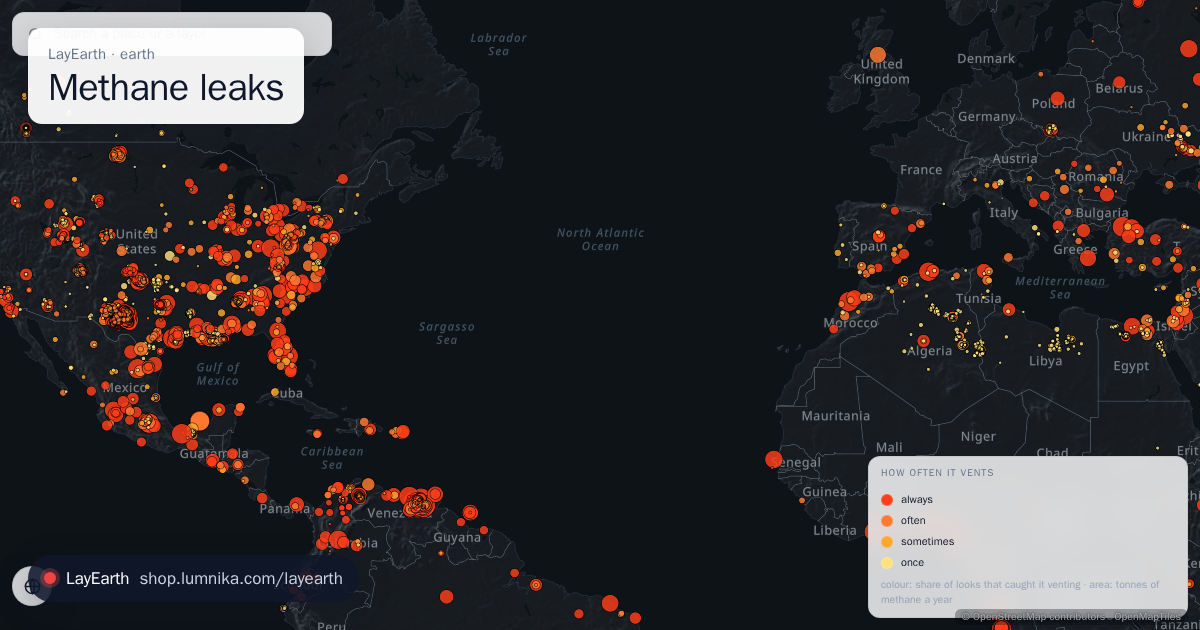 Methane leaks
Every methane source that satellites and survey aircraft have caught venting, worldwide: 11,000-plus sites in the Carbon Mapper catalogue, from Permian oil wells to Turkmen pipelines, Chinese coal mines and city landfills.
-
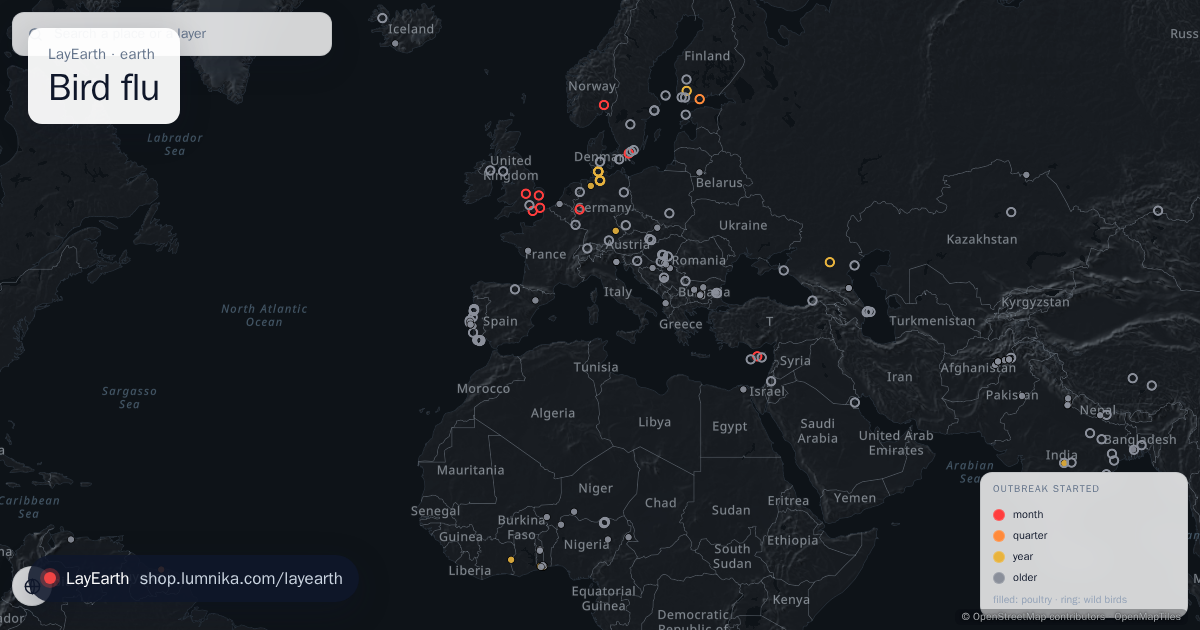 Bird flu
Every bird-flu outbreak that a national veterinary service has notified to WOAH, the world animal health organisation: poultry farms and wild-bird finds, H5N1 and its cousins, on every continent, newest first.
-
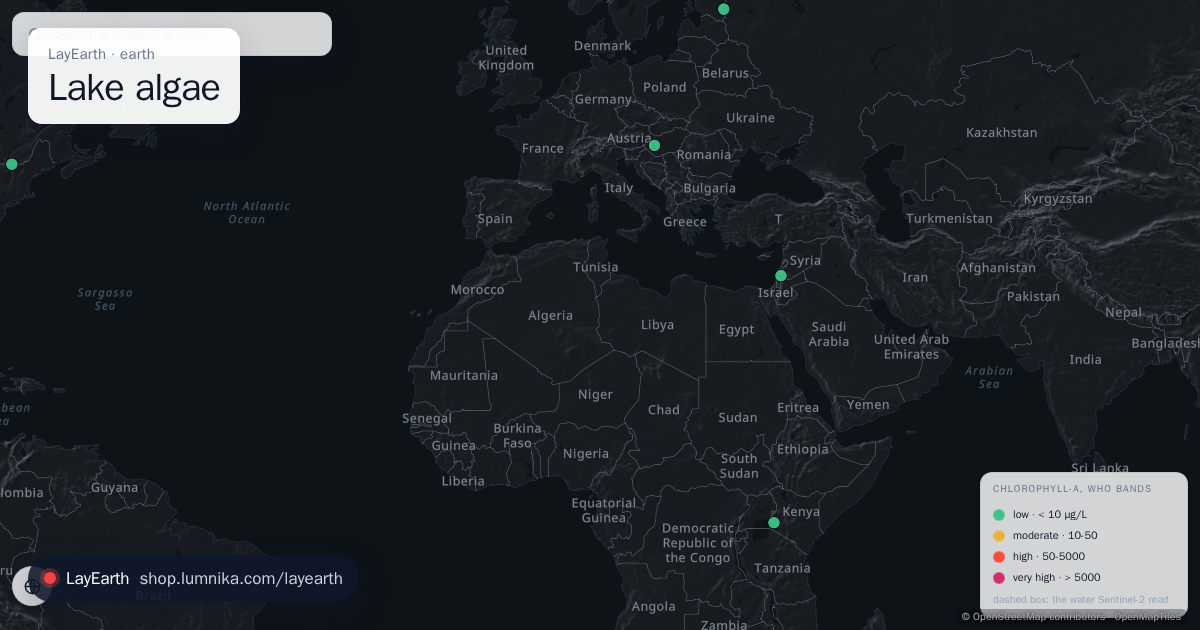 Lake algae
Is this lake growing a toxic algal bloom? Sentinel-2 reads the red-edge colour cyanobacteria give water, on every lake on Earth every few days.
-
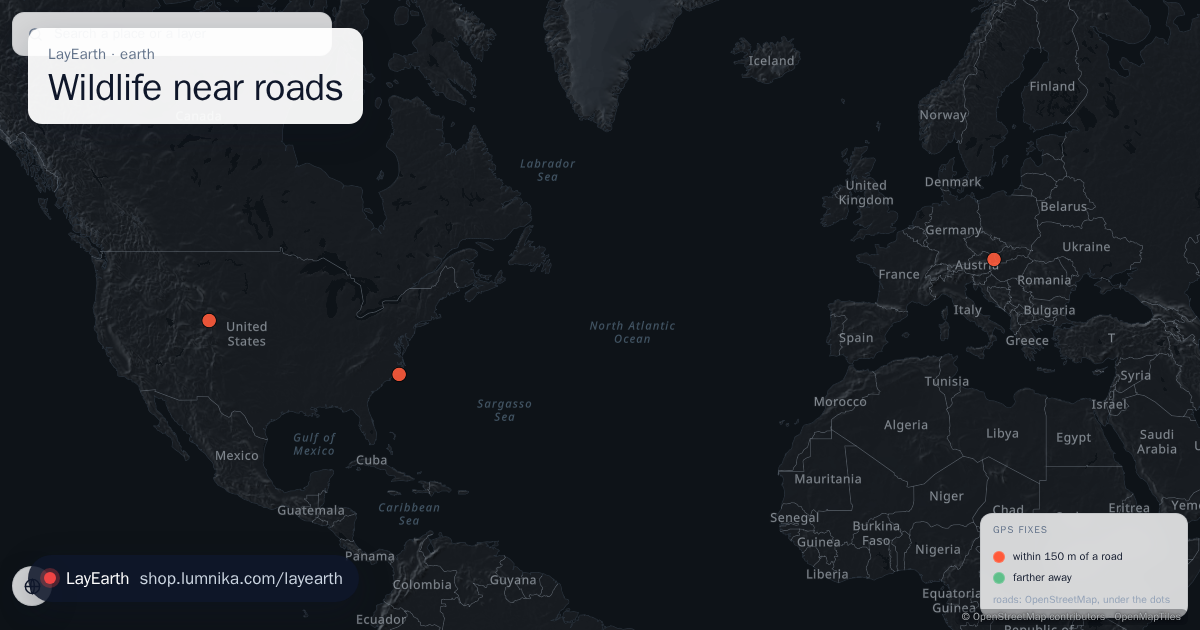 Wildlife near roads
When is a wild animal population actually next to traffic? Movebank publishes the raw GPS collars of tracked wildlife; OpenStreetMap publishes the roads.
-
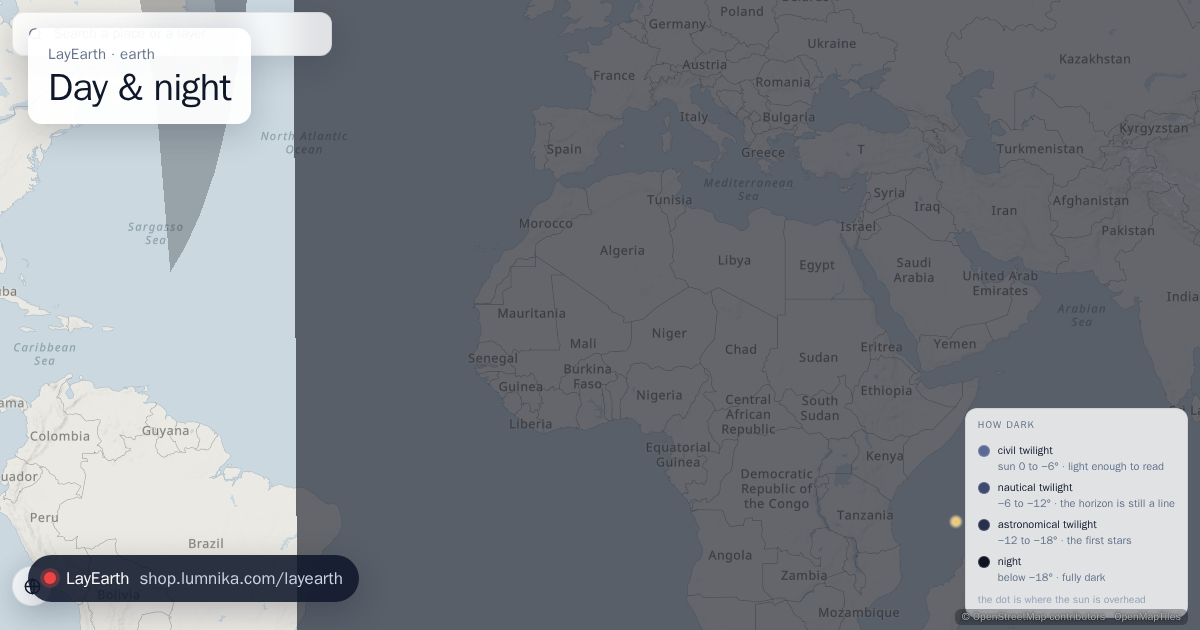 Day & night
Where it is dark right now, drawn as the three twilights and full night instead of a single day-night line.
-
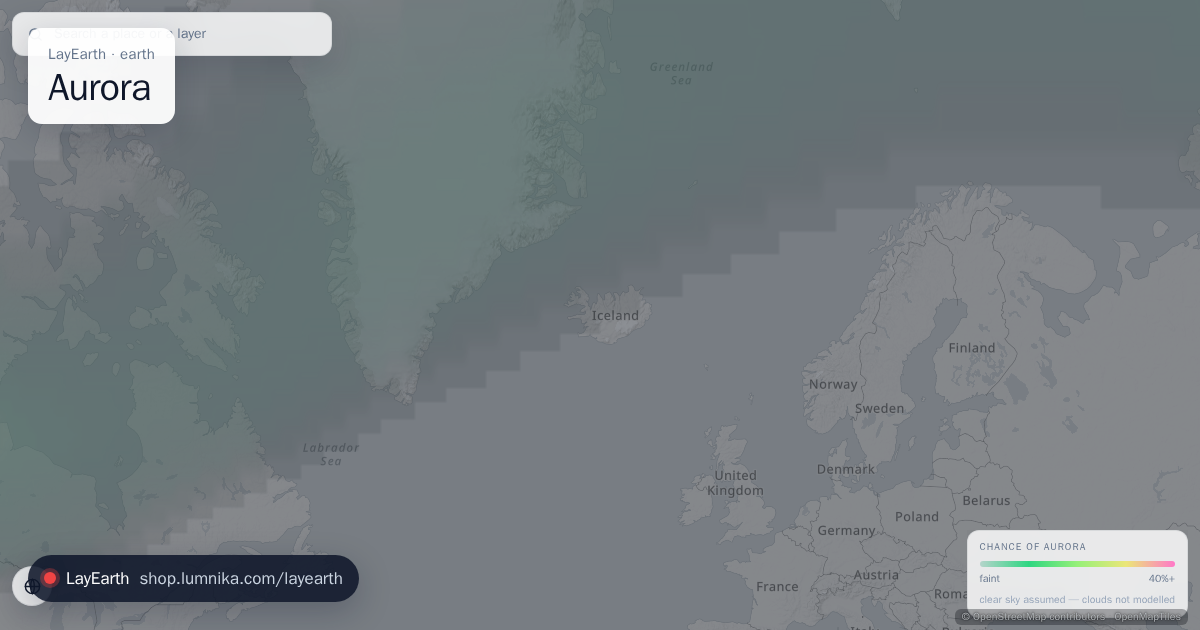 Aurora
The chance of seeing an aurora, about half an hour ahead, on a 1-degree grid covering the planet.
business · aviation and risk data
-
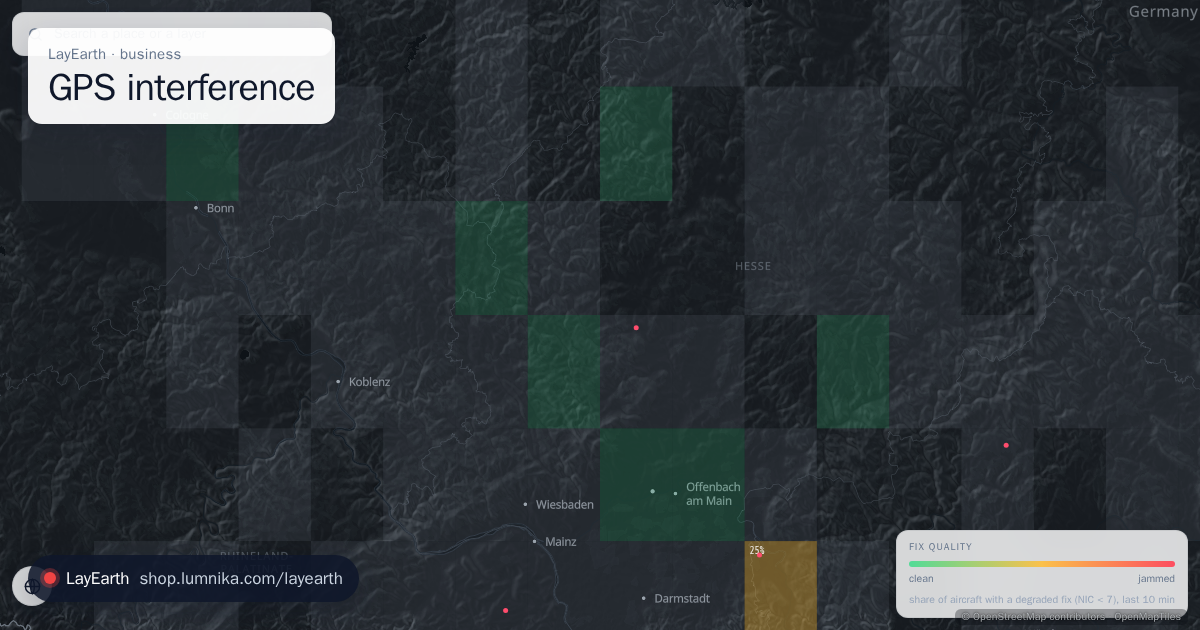 GPS interference Pro
Where GPS is being jammed or spoofed, measured by the aircraft flying through the area.
-
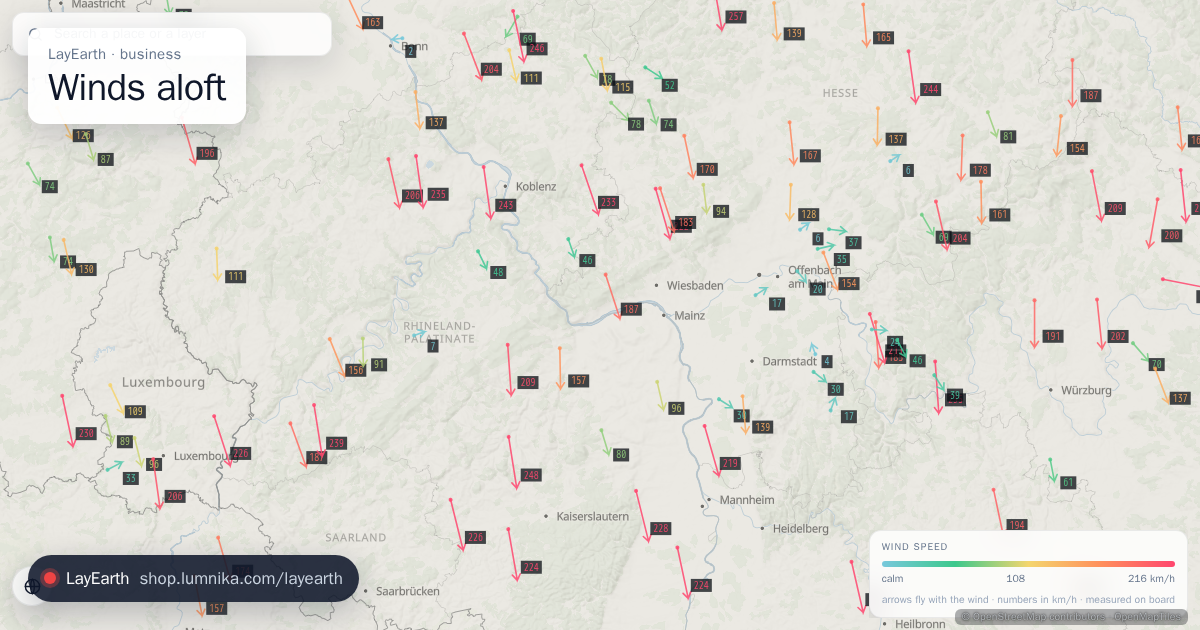 Winds aloft Pro
Wind at cruising altitude as measured on board by aircraft in flight.
-
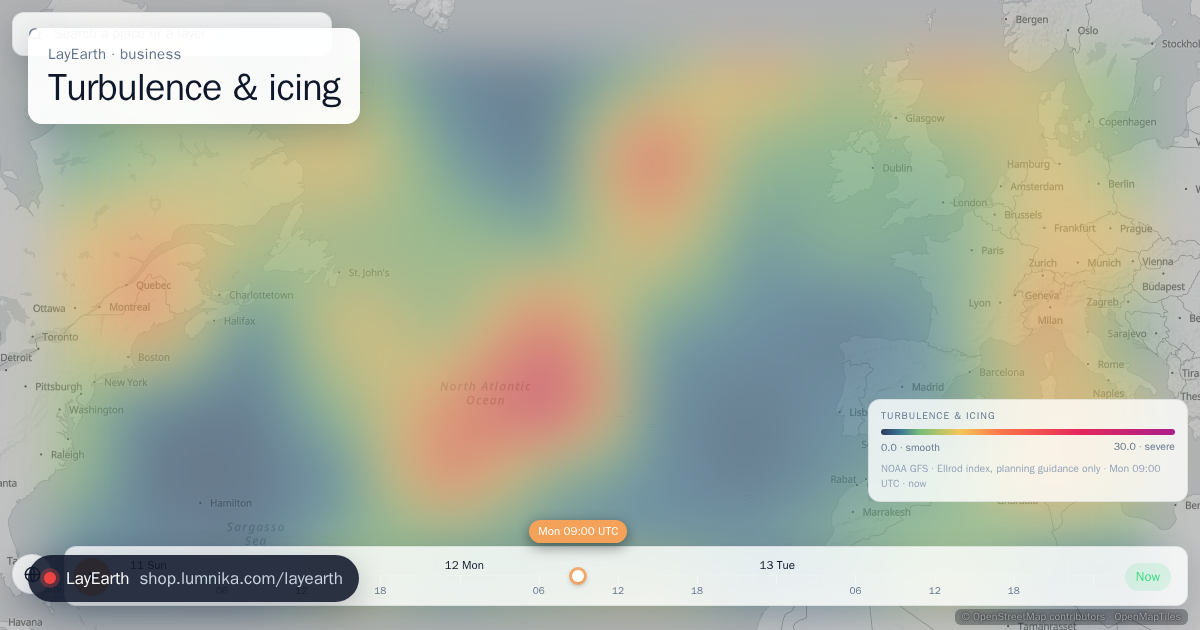 Turbulence & icing Pro
Clear-air turbulence at cruise and airframe icing lower down, from the NOAA GFS model.
-
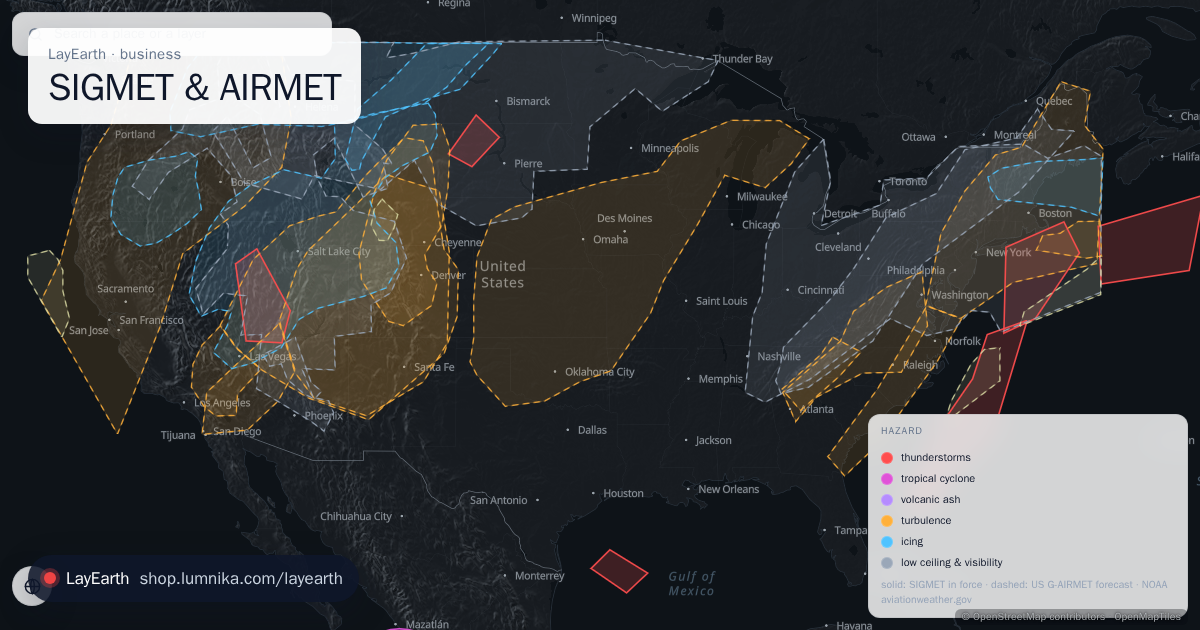 SIGMET & AIRMET Pro
The aviation weather warnings in force right now, as polygons: every SIGMET issued in the world (thunderstorms, severe turbulence, severe icing, mountain waves, volcanic ash, tropical cyclones) and, over the United States, the G-AIRMET forecast of moderate turbulence, icing, low ceilings and obscured mountains.
-
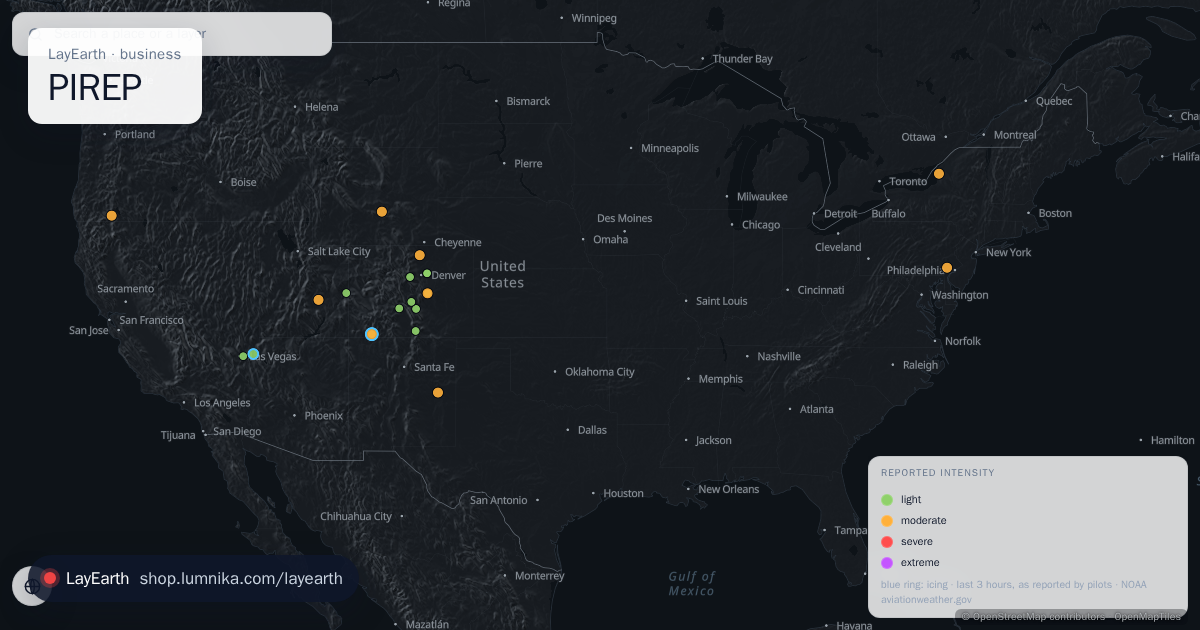 PIREP Pro
Turbulence and icing as pilots reported them from the cockpit in the last three hours, worldwide: each report where it was felt, with flight level, aircraft type, intensity and the original PIREP or AIREP text.
 My data